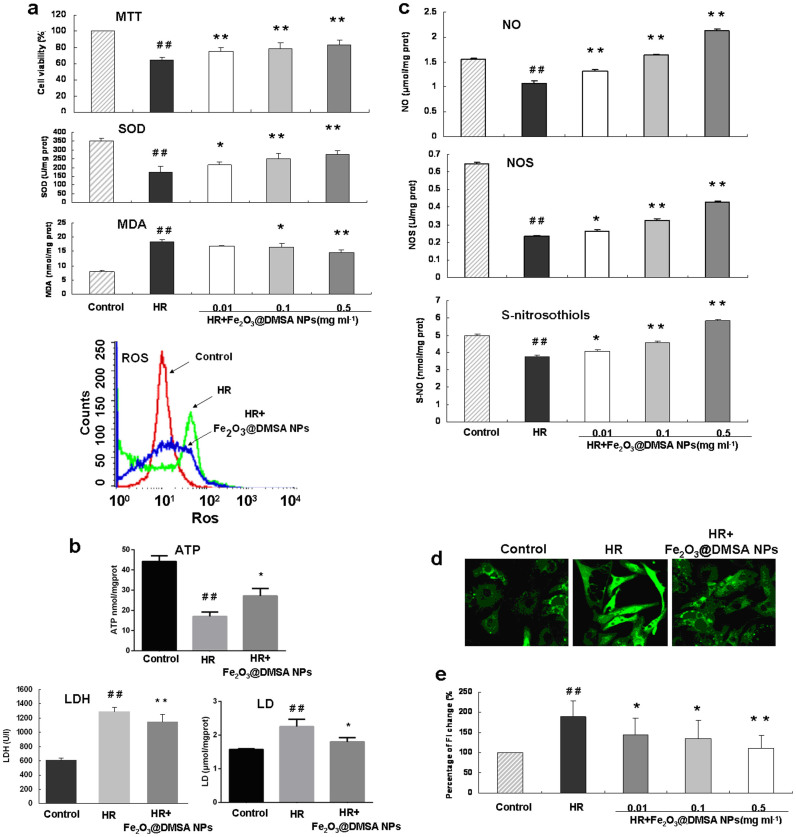
Figure 4. Effects of Fe2O3@DMSA NPs on cardiomyocytes under a hypoxia and reoxygenation (HR) condition.
(a), Cardiomyocytes were exposed to hypoxia (95% N2 and 5% CO2) for 6 h followed by 6 h of reoxygenation (95% O2 and 5% CO2) (HR) and effects of Fe2O3@DMSA NPs on cell viability, generation of SOD, MDA and ROS (a), on LDH, LD and ATP (b), and on generation of NO, NOS and S-NO were measured (c). Confocal images of intracellular calcium signal of cardiomyocytes of control, HR and HR + Fe2O3@DMSA NPs (0.1 mg ml−1) group (d). The fluorescent intensity (FI), which indicates intracellular Ca2+ concentration, was quantified (e). * p < 0.05 vs the IR group; ** p < 0.01 vs the IR group; ## p < 0.01 vs the control group; n = 6.

