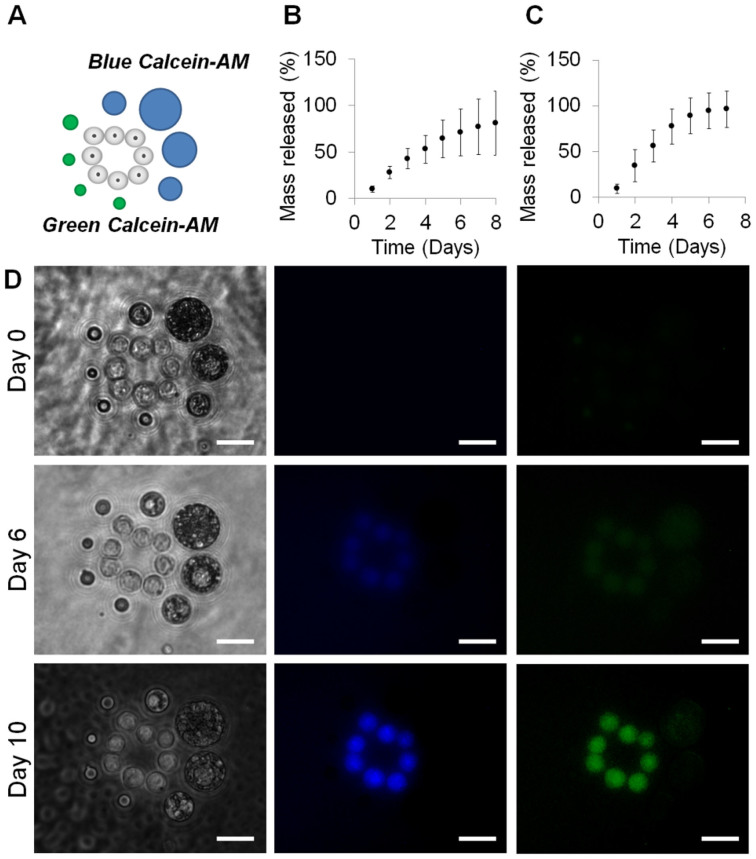
Figure 4.
Controlled release of green and blue labelled Calcein-AM from PLGA microspheres positioned at precise locations around mES cells within agarose gels and cultured over 10 days. (B). Release profiles for blue Calcein-AM microparticles. (C). Release profiles for green Calcein-AM microparticles. (D). Bright-field and fluorescent images of resulting cultures at zero, six and 10 days after pattern formation. Scale bars = 12 μm.

