. 2015 Feb 11;4:e06303. doi: 10.7554/eLife.06303

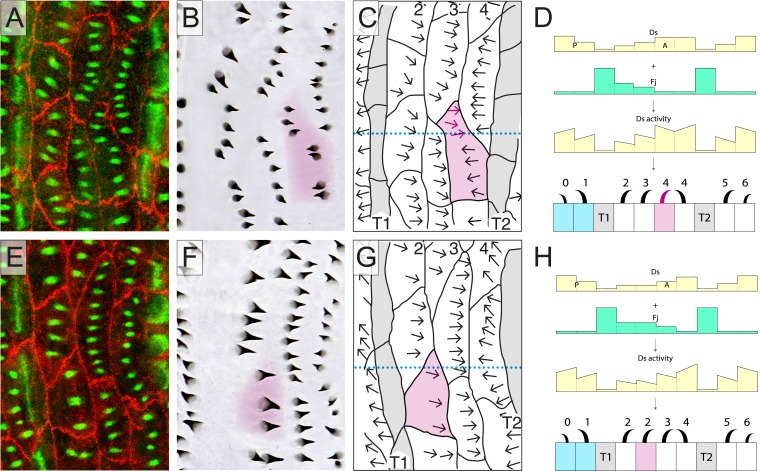
Figure 2. Atypical cells.

(AD) One atypical and multipolar cell, largely in row 4, is shown, in BD (shaded in magenta). The transects shown as dotted lines in C and G are illustrated in D and H with the presumed amounts of Ds and Fj as well as the presumed activity of Ds. (EH) One atypical cell of row 2 is shown; labelling as in other figures. See also Figure 2—figure supplement 1.

DOI: http://dx.doi.org/10.7554/eLife.06303.003

Figure 2.

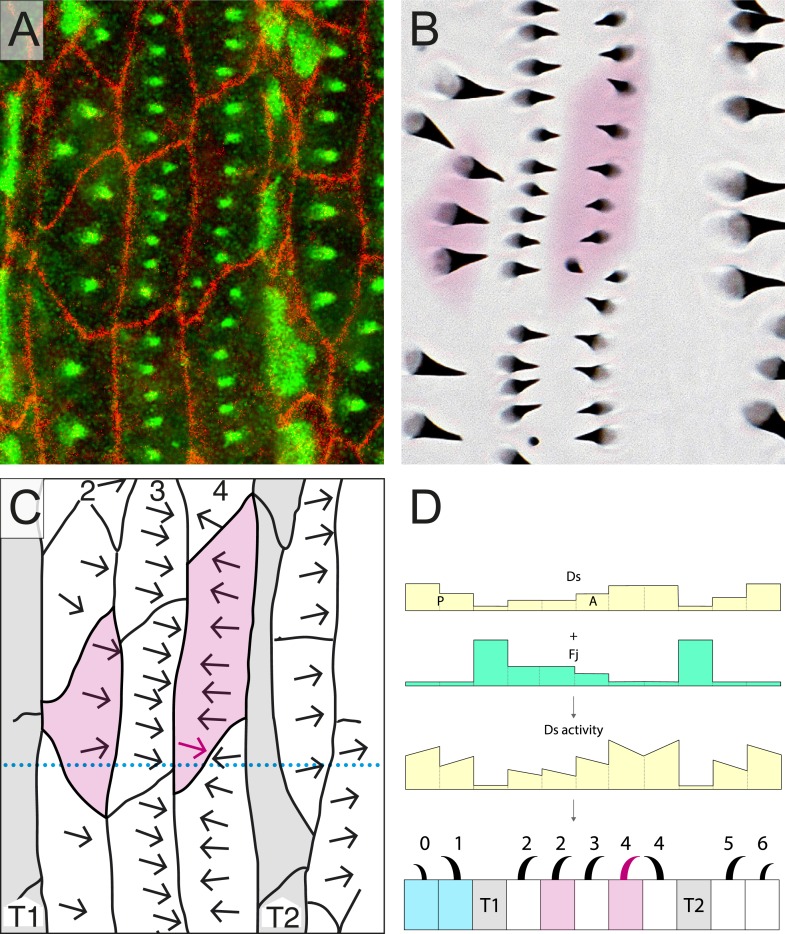
Figure 2—figure supplement 1. Atypical cells: more examples.

Figure 2—figure supplement 1.

An example (A-D) showing two atypical cells, one in row 2, one in row 4. Even though much of the row 2 cell abuts, not T1 as is ‘typical’, but in other row 2 cells, the polarities of all denticles are always normal (Table 1). The row 4 atypical cell is of interest because it has only a small promontory that abuts another row 4 cell, and yet this small promontory has one posteriorly oriented denticle. Presented as the other figures. Related to Figure 2.