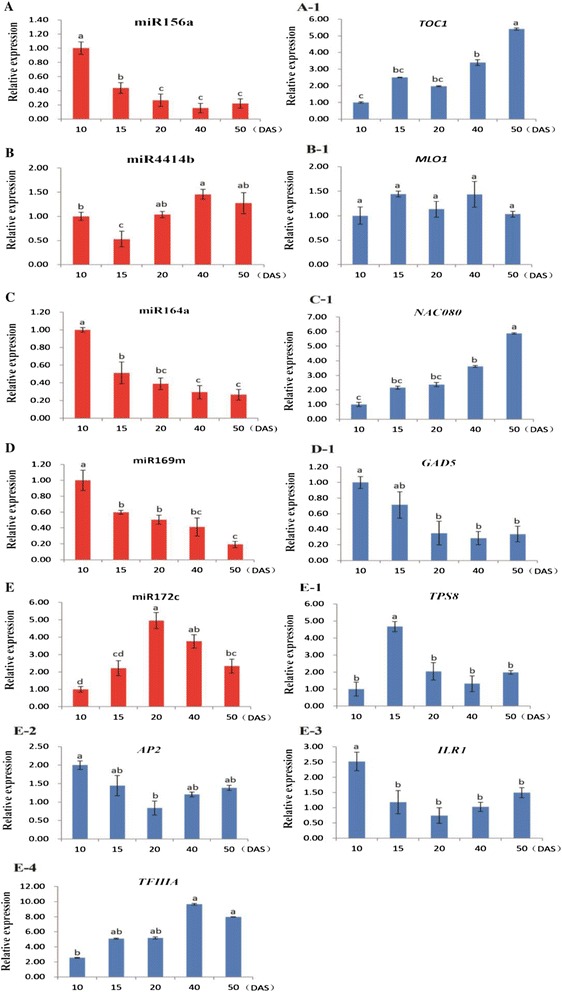
Figure 8.

Quantitative expression analyses of five differentially expressed miRNAs (A ~ E) and their target genes (A-1 ~ E-4). Each bar shows the mean ± SE of triplicate assays. The values with different letters indicate significant differences at P < 0.05 according to Duncan’s multiple range tests.
