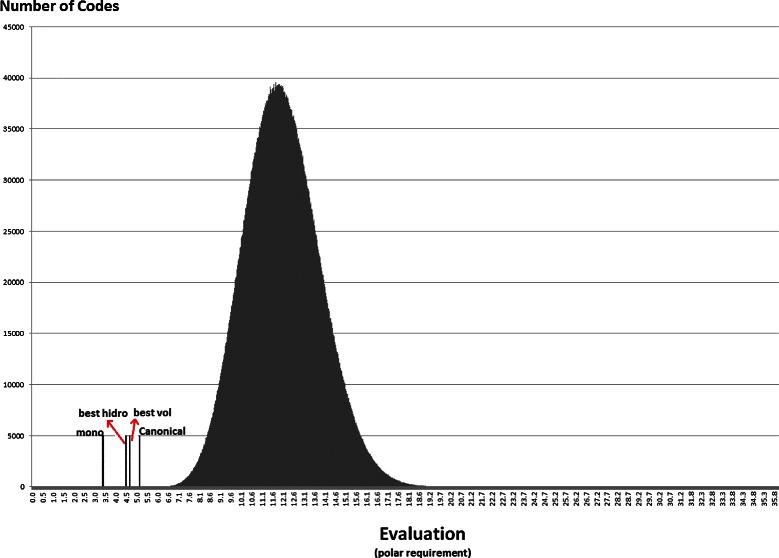
Figure 7.

Empirical distribution for the evaluation function, when M s is used with polar requirement. For each objective, the horizontal axis shows ranges of the evaluation while the vertical axis gives the number of codes found in the respective range. The evaluation of the canonical genetic code and the objective values of the solutions with the best pmd obtained in the previous experiments are also plotted.
