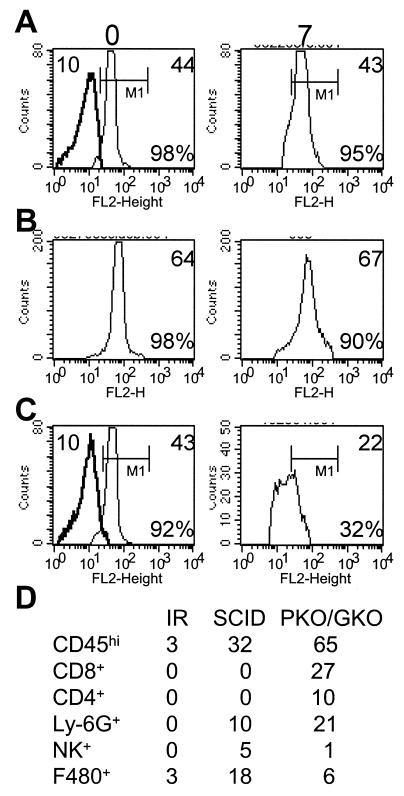
FIG. 3.
CEACAM1a expression on microglia from immunodeficient mice. (A to C) CD45low microglia isolated from naïve (left) or infected irradiated BALB/c (A), SCID (B), or PKO/GKO (C) mice at day 7 p.i. (right) stained for CEACAM1a (light line) or the isotype control (dark line). Regions and gates are described in Fig. 1. Numbers in the upper parts of the histograms are MFI values for CEACAM1a (right) or the isotype control (left). Percentages of microglia expressing CEACAM1a are given in the bottom right parts of the histograms. (D) Percentages of CD45high infiltrating cells and distinct phenotypic populations in irradiated BALB/c (IR), SCID, and PKO/GKO mice at 7 days p.i. The data presented are representative of three to five experiments.

