
Figure 2.
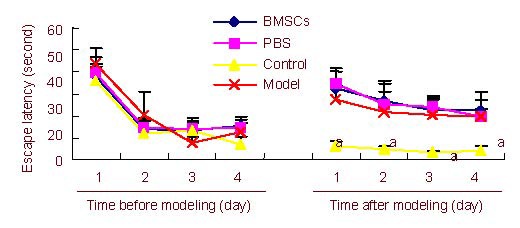
Escape latency measured in the Morris water maze before and after inducing PD.
Data are expressed as mean ± SD and were compared by one-way analysis of variance with least significant difference-ttests for multiple comparisons. aP < 0.05, vs. the BMSCs-treated PD group, the PBS-treated PD group and the untreated PD group.
BMSCs: Bone marrow stromal cells; PBS: phosphate-buffered saline; PD: Parkinson's disease.