Figure 2.

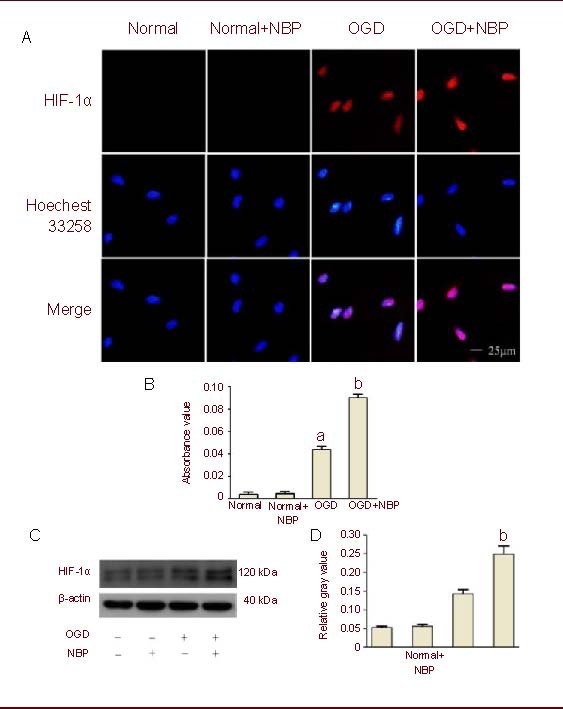
DL-3-n-butylphthalide (NBP) enhanced oxygen glucose deprivation (OGD)-induced expression of hypoxia inducible factor-1α (HIF-1α).
(A) Brain microvascular endothelial cells (BMECs) underwent 2-hour OGD and 24-hour reperfusion after 1-hour pretreatment with NBP (100 μM). Digital photomicrograph under fluorescent illumination shows the expression of HIF-1α (blue: Hoechst; red: Cy5).
(B) Bar graph shows the average quantitative absorbance of HIF-1α through Image-Pro Plus analysis of immunofluorescence. The level of HIF-1α expression was indicated by the value of absorbance over the area with fluorescence.
(C) Expression of HIF-1α was detected by western blot method. Blots were probed with antibody against HIF-1α, and β-actin was used as a control.
(D) Bar graph shows semi-quantitative densitometry from western blot analysis. HIF-1α was significantly increased in BMECs exposed to OGD insult, whereas NBP (100 μM) significantly enhanced OGD-induced HIF-1α expression.
Values were expressed mean ± SEM. The results were obtained from five independent experiments performed in triplicate. aP < 0.05, vs. the normal group (control); bP < 0.05, vs. the OGD group (one-way analysis of variance with the least significant difference post hoc test).
