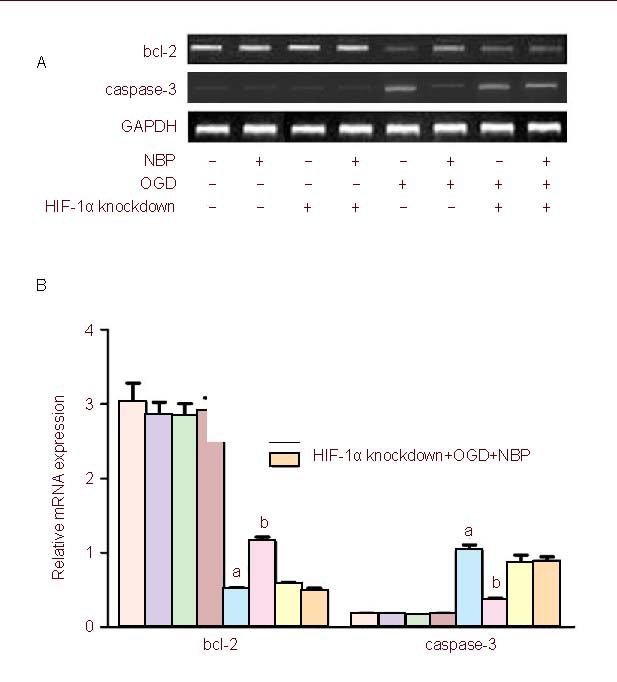
Figure 4.

Quantitative analysis of the mRNA expression of hypoxia inducible factor-1α (HIF-1α), bcl-2 and caspase-3 by real-time RT-PCR.
Glyceraldehyde-3- phosphate dehydrogenase (GAPDH) was used as a loading control.
(A) While transfected with HIF-1α RNA interference, the upregulation of bcl-2 and downregulation of caspase-3 by DL-3-n-butylphthalide (NBP) were inhibited when brain microvascular endothelial cells were exposed to oxygen glucose deprivation (OGD).
(B) The bar graphs represent the data expressed as fold-increases over controls. Values were expressed as mean ± SEM.
The results were obtained from five independent experiments performed in triplicate. aP < 0.05, vs. the normal group; bP < 0.05, vs. normal + OGD group (one-way analysis of variance with the least significant difference post hoc test).
