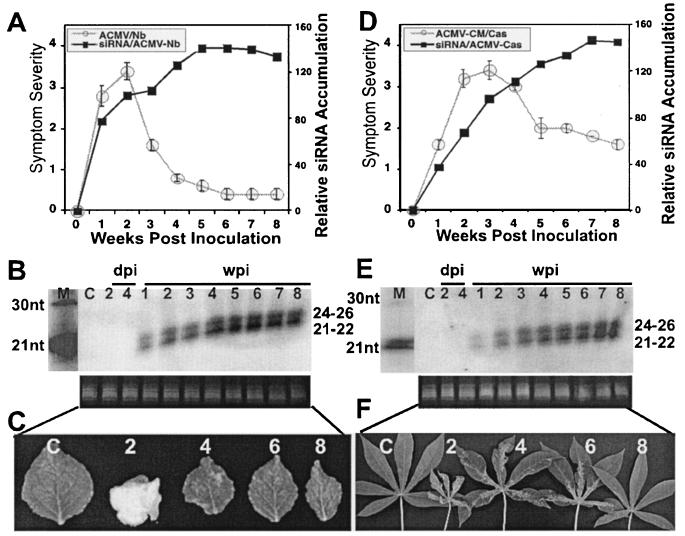
FIG. 1.
Relationship between symptom severity, recovery, and siRNA accumulation in ACMV-[CM]-infected N. benthamiana and cassava plants. (A and D) ACMV-[CM] symptom severity and siRNA accumulation trend in N. benthamiana (A) and in cassava (D). A total of 15 N. benthamiana and cassava plants were inoculated as five plants in three experiments. Bars in the symptom severity curve indicate the standard error (SE) values of 15 plants. (B and E) RNA gel blots probed with [∝-32P]dCTP-labeled DNA-A and DNA-B of ACMV-[CM] in N. benthamiana (B) and in cassava (E) at days 2 and 4 in inoculated leaves and at weeks 1 to 8 in systemically infected leaves. The left lane shows [γ-32P]ATP-end-labeled oligonucleotide markers of 21 and 30 nt. Each lane was loaded with 40 μg of low-molecular-weight RNA. Ethidium bromide-stained RNA is shown as a loading control. (C and F) Representative leaves showing different degrees of symptoms and recovery phenotypes at 2, 4, 6, and 8 wpi in N. benthamiana (C) and cassava (F). The C within the blots and leaf panels represents a mock-inoculated, control plant.

