. 2015 Jan-Mar;37(1):66–70. doi: 10.4103/0253-7176.150822
Copyright: © Indian Journal of Psychological Medicine
This is an open-access article distributed under the terms of the Creative Commons Attribution-Noncommercial-Share Alike 3.0 Unported, which permits unrestricted use, distribution, and reproduction in any medium, provided the original work is properly cited.
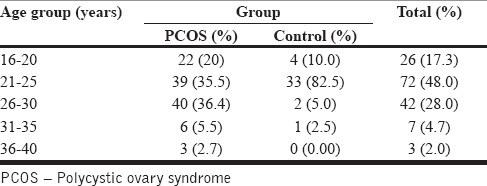
Table 2.
Age distribution