
Figure 3.
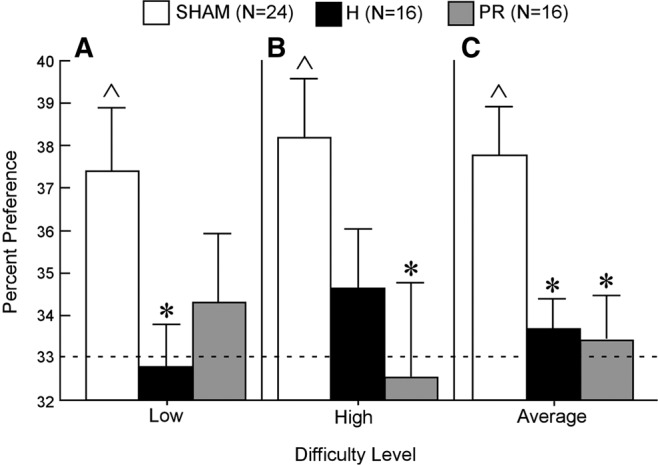
Simultaneous oddity discrimination by Sham (white), H (black), and PR (gray) groups (rats). Data are 5-min cumulative scores (time spent exploring the odd object divided by total exploration time for the odd and identical objects combined) in the (A) “low” condition, (B) “high” condition, and (C) average of the “low” and “high” conditions. The dotted line shows chance performance (33.33%). Error bars indicate SEM. Asterisks indicate a difference from the Sham group (P < 0.05). Carets indicate performance above chance (P < 0.05, chance = 33.3%).