
Figure 6.
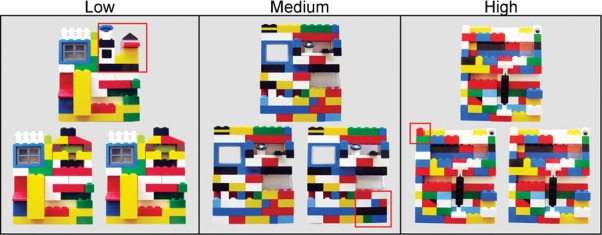
Examples of the Lego images used in the “low,” “medium,” and “high” conditions of Experiment 3. The red box outlines the altered quadrant in the odd image. In the “low” condition, 100% of the quadrant was altered, in the “medium” condition 50% of the quadrant was altered, and in the “high” condition 25% of the quadrant was altered.