
Figure 7.
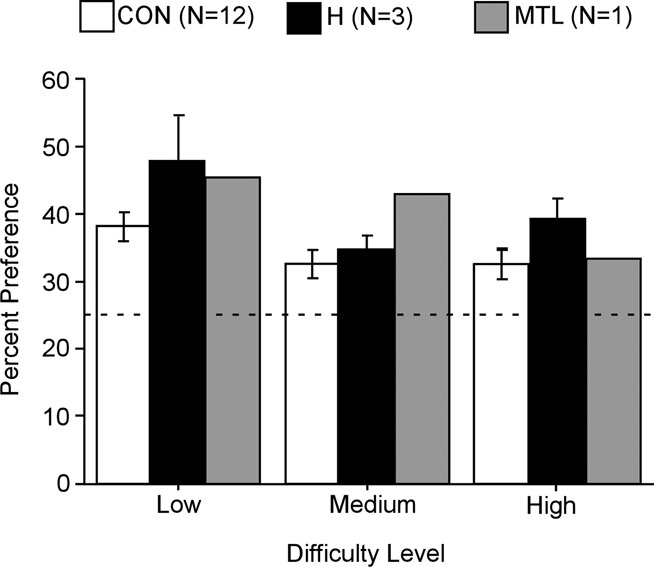
Simultaneous oddity discrimination by Control (white), H (black), and MTL (gray) groups (humans). Viewing preference for the altered critical quadrant (and the corresponding quadrant in the other two images) is shown as the percent of viewing time across the entire 20-sec trial. All participants showed a bias for the critical quadrants at all three levels of difficulty. The dotted line shows chance performance (25%). Error bars indicate SEM.