
Figure 1.
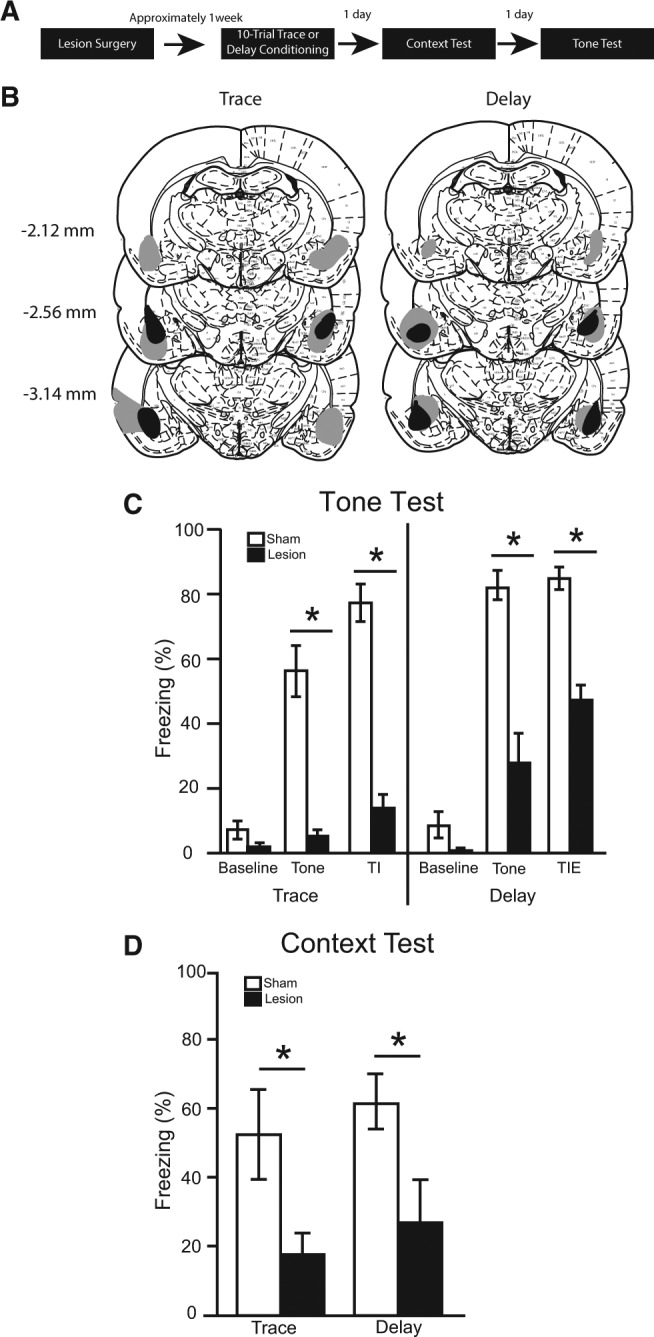
(A) Timeline for Experiment 1. (B) The minimum (black) and maximum (gray) extent of bilateral lesions in BLA (atlas images taken and modified from Paxinos and Watson 1998 with permission from Elsevier 1998). The number of animals in each group was as follows: trace sham, n = 7; trace lesion, n = 7; delay sham, n = 8; delay lesion, n = 9; N = 31. (C) The percentage of time spent freezing during the baseline period (first 3 min), tone, and trace interval or trace interval equivalent during the tone test. (D) Simultaneously learned contextual fear expressed during the context test.