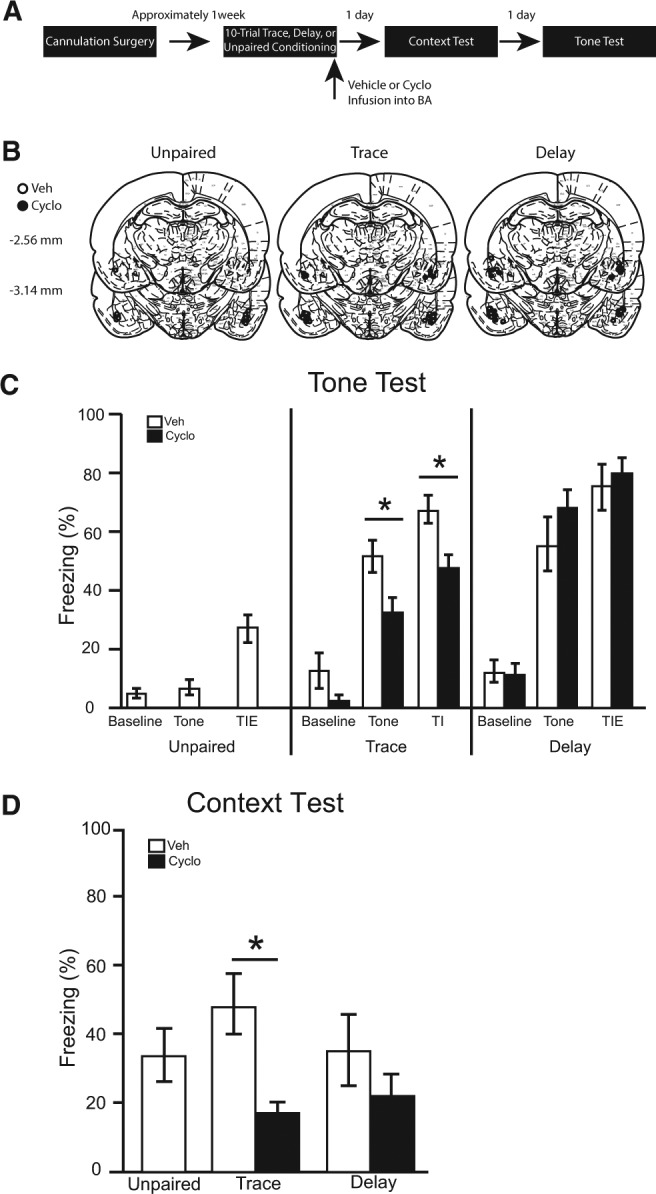
Figure 2.

(A) Timeline for Experiment 2. (B) Cannula placement for all animals included in Experiment 2 (atlas images taken and modified from Paxinos and Watson 1998 with permission from Elsevier 1998). The number of animals in each group was as follows: unpaired veh, n = 9, trace veh, n = 11; trace cyclo, n = 11; delay veh, n = 10; delay cyclo, n = 10; N = 51. (C) The percentage of time spent freezing during baseline period (first 3 min), tone, and trace interval or trace interval equivalent during the tone test. (D) Simultaneously learned contextual fear expressed during the context test.
