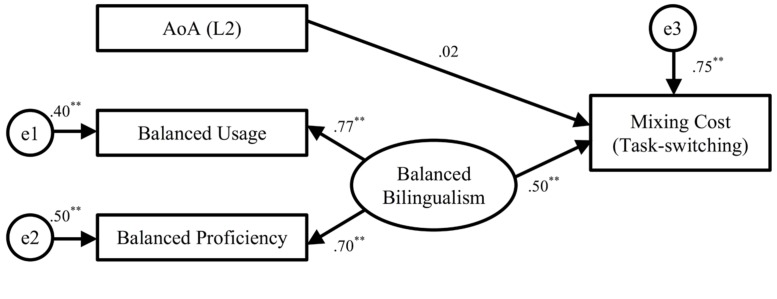
FIGURE 2.
Structural equation model of the mixing cost in task-switching. N = 70. The standardized maximum likelihood parameter estimates are shown. The error variances (e1, e2, and e3) indicate the amount of unexplained variance. Thus, for the observed variable of Balance Usage, Balanced Proficiency and Mixing Cost, R2 = (1 - error variance). **p < 0.01.

