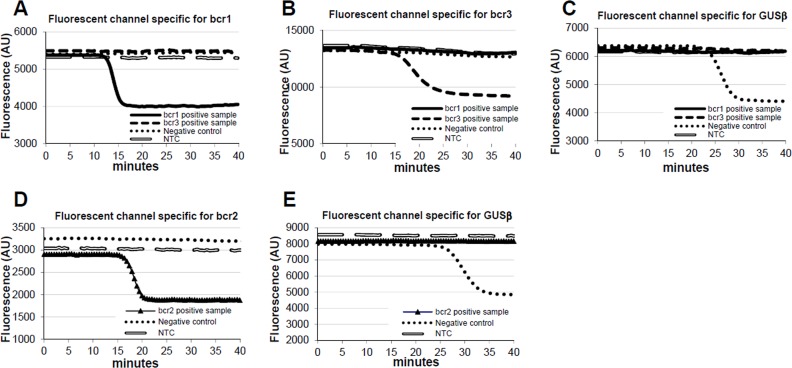
Figure 3. PML-RARA RQ-LAMP amplification plots.
Representative amplification curves of bcr1 (Panel A), bcr3 (Panel B) and bcr2 (Panel D) PML-RARA positive cases obtained with triplex and duplex assays, respectively. Negative controls are represented in Panel C and E in which the only GUSβ gene is amplified.

