Figure 1.
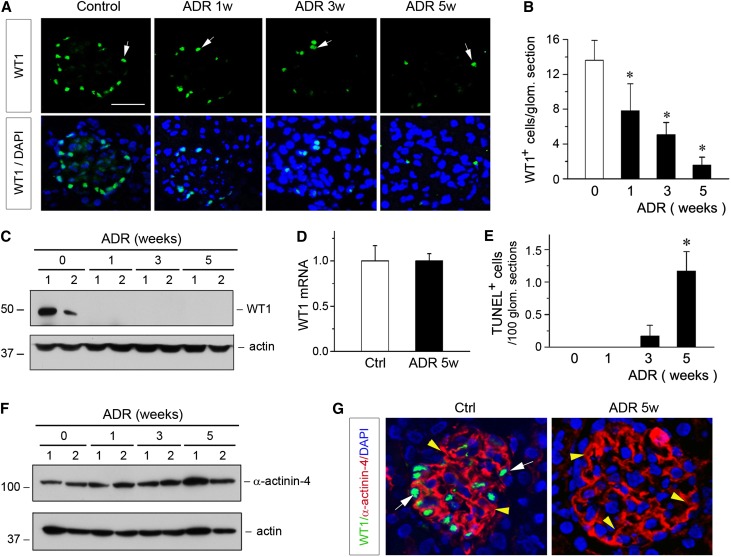
Loss of WT1 in ADR nephropathy is not caused by podocyte depletion. (A) Representative micrographs show glomerular WT1 staining at different time points after ADR injection. BALB/c mice were injected with ADR, and kidney tissues were collected at 1, 3 and 5 weeks postinjection, and stained for WT1. Arrows indicate WT1-positive staining. DAPI, 4′,6-diamidino-2-phenylindole. (B) Quantitative determination of the WT1-positive cells in different groups. WT1-positive cells were counted in 10 randomly chosen glomerular sections, and the averages of the WT1-positive cells per glomerular section were calculated. *P<0.05 versus normal controls (n=5–6). (C) Representative Western blotting shows renal WT1 protein levels in various groups as indicated. Numbers (1 and 2) indicate the individual animal in a given group. (D) qRT-PCR analyses show no difference in renal WT1 mRNA expression at 5 weeks after ADR injection. Ctrl, control. (E) Quantitative determination of the apoptotic glomerular cells. Kidney paraffin sections were subjected to TUNEL staining. TUNEL-positive glomerular cells were counted in different groups. Data are presented as numbers of apoptotic cells per 100 glomerular sections. *P<0.05 versus normal controls (n=5–6). (F) Western blotting shows α-actinin-4 protein abundance at different time points after ADR injection. Numbers (1 and 2) indicate the individual animal in a given group. (G) Representative micrographs show the double immunostaining for WT1 (green) and α-actinin-4 (red) in the kidneys of control (Ctrl) and ADR mice at 5 weeks after injection (ADR 5w). White arrows indicate WT-1–positive staining, whereas yellow arrowheads show α-actinin-4–positive staining.

