Figure 2.
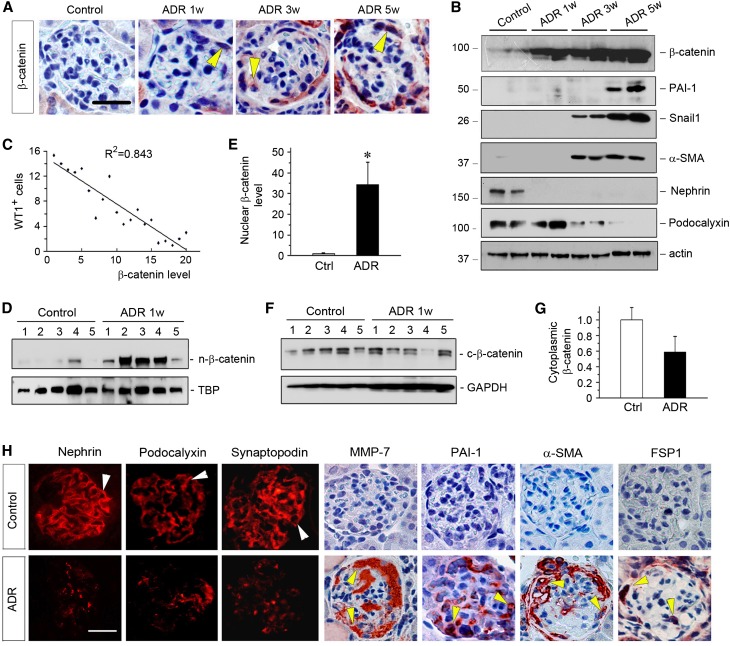
Loss of WT1 is associated with β-catenin activation and phenotypic transition of podocytes in ADR nephropathy. (A) Representative micrographs show glomerular β-catenin staining in different groups as indicated. Arrowheads indicate β-catenin–positive podocytes. Scale bar, 35 µm. (B) Representative Western blotting shows dramatic changes in podocyte-specific proteins as well as β-catenin and its target genes. Kidney lysates were immunoblotted with specific antibodies against β-catenin, PAI-1, Snail1, α-SMA, nephrin, podocalyxin, and actin. (C) Linear regression shows an inverse correlation between WT1-positive cells per glomerular section and β-catenin protein abundance (arbitrary units) at different time points after ADR injection. The correlation coefficient (R2) is shown. (D–G) Activation and nuclear translocation of β-catenin occurs at 1 week after ADR injection. Nuclear and cytoplasmic proteins were fractionated from the kidneys of control and ADR mice at 1 week after injection and subjected to Western blot analyses. Nuclear β-catenin was normalized to TATA-binding protein (TBP), whereas cytoplasmic β-catenin was normalized to glyceraldehyde-3-phosphate dehydrogenase (GAPDH). (D and F) Western blots and (E and G) quantitative data are presented. Numbers (1–5) represent individual animals in a given group. *P<0.05 versus normal controls (n=5). Ctrl, control. (H) Representative micrographs show phenotypic changes of glomerular podocytes in ADR nephropathy. Kidney sections prepared from mice at 5 weeks after ADR injection or controls were stained with specific antibodies against nephrin, podocalyxin, synaptopodin, MMP-7, PAI-1, α-SMA, and FSP-1. Arrowheads indicate positive staining. Scale bar, 30 µm.

