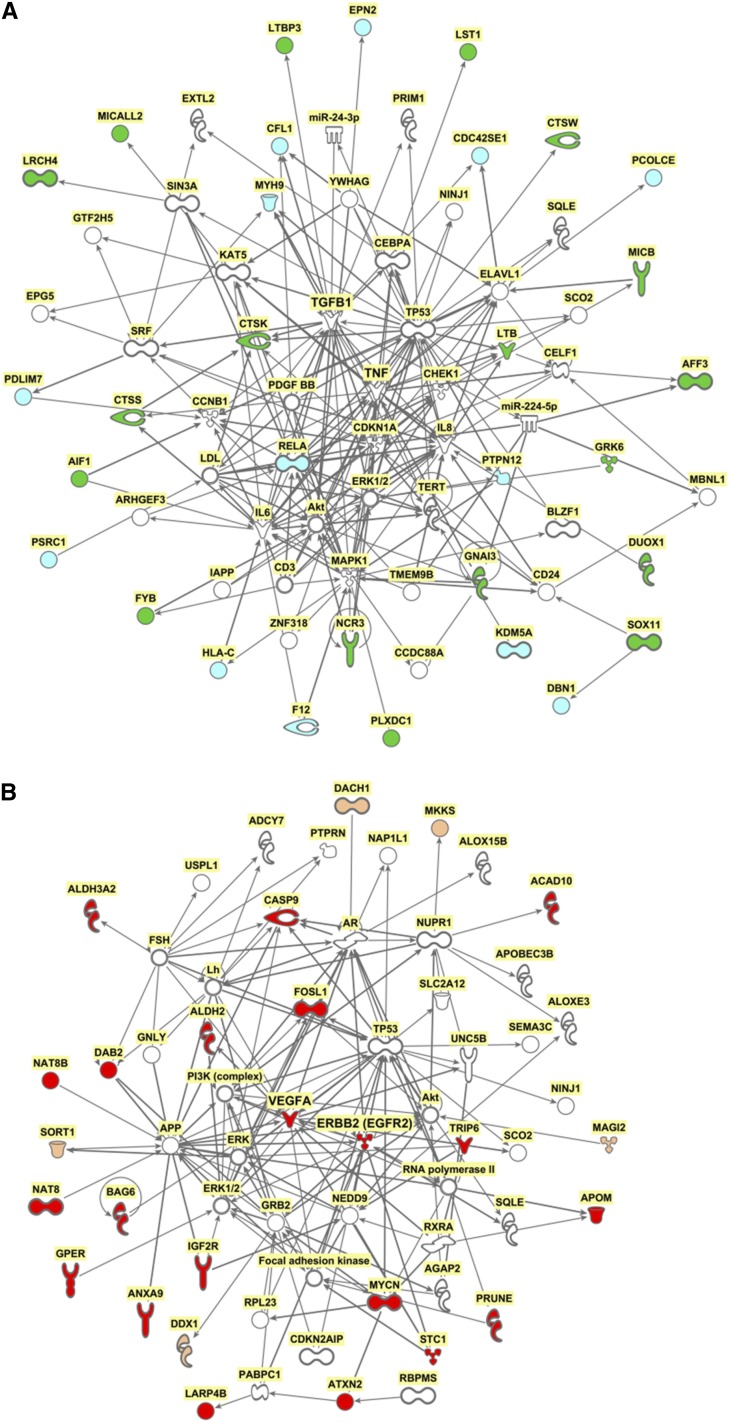
Figure 6.
Kidney function-correlating CRATs form tight networks. (A) CRATs showing negative correlation with eGFR (green with P corrected<0.05) clustered around TNF and TGF-β. (B) CRATs showing positive correlation with eGFR (red with P corrected<0.05) centered around VEGFA and ERBB2 [erythroblastic leukemia viral oncogene homolog 2 (EGFR2, epidermal growth factor receptor 2)] (Ingenuity Systems).

