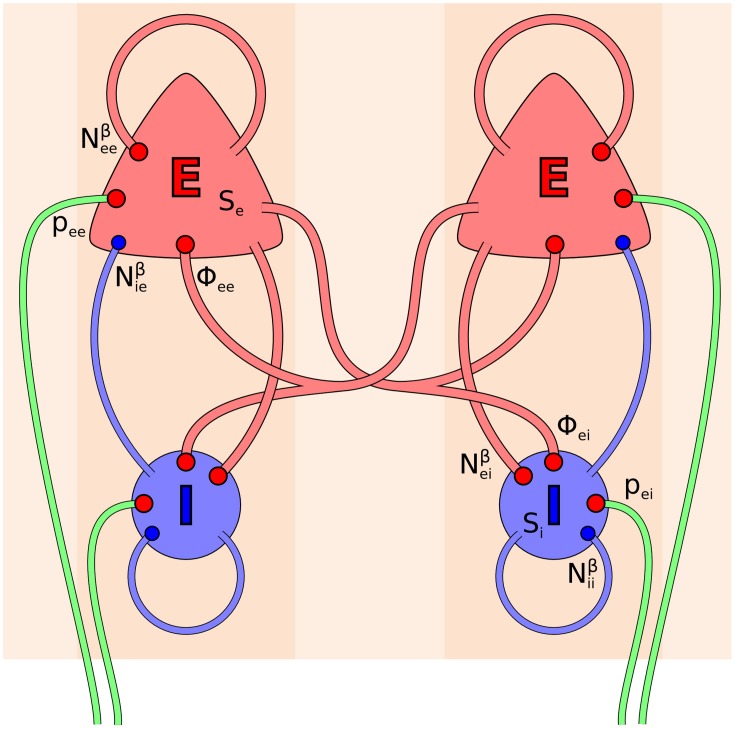
Figure 1.
Topology of the Liley model (Liley et al., 2002; Bojak and Liley, 2005). Its two distinct neural populations (E = excitatory, I = inhibitory) are shown for two separate positions on the cortical sheet. Each one can be considered as representing a single macrocolumn. All synaptic connections that occur in the model are shown by red (excitatory) and blue (inhibitory) disks, respectively. Extracortical inputs to the cortical populations are shown by green fibers. Symbols illustrate the various inputs to the excitatory population in the left macrocolumn and to the inhibitory population in the right macrocolumn, respectively, according to Equations (3, 4).

