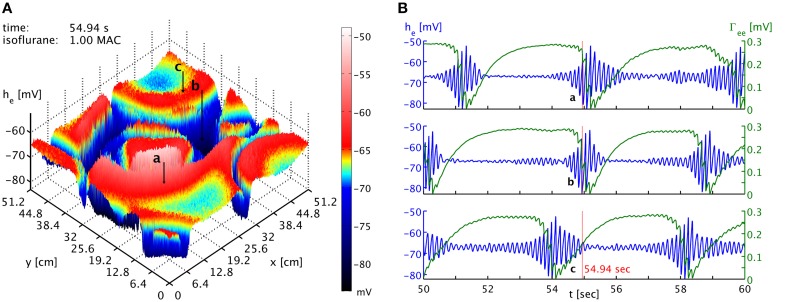
Figure 3.
(A) Snapshot of the he activity of the cortical surface at simulation time 54.94 s under the influence of 1 MAC isoflurane. Black arrows with labels “a,” “b,” and “c” point to the cortical locations of the time series shown in the other panel. Note the toroidal boundaries, e.g., the circular burst front that appears cut off around (x,y) = (44.8, 0) cm continues at x = (44.8, 51.2) cm. (B) Time series of he (blue) and Γee (green) taken from the three different positions marked as “a,” “b,” and “c” in the other panel. It is obvious that bursts are not generally synchronized in time at the different positions. Spatiotemporal correlations from propagating “burst waves” can occur, but are removed at larger distances by the interference from other emergent patterns. An animation of this simulation is provided as Movie 1 in the Supplementary Material.

