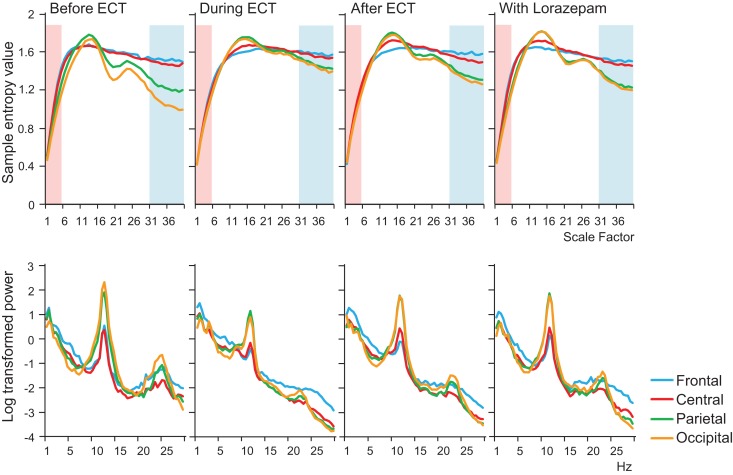
Figure 1.
Results of multiscale entropy (MSE) analysis (upper panel) and power spectrum analysis (lower panel) conducted before electroconvulsive therapy (ECT), during ECT, after ECT, and during treatment with lorazepam. Each panel shows averaged MSE and power spectrum results from each condition. A decrease in sample entropy (SampEn) was observed with ECT at lower scale factors (SFs) 1–5 (highlighted with light pink shaded area). By contrast, increased SampEn was observed at higher SFs 31–40 (light blue shaded area).

