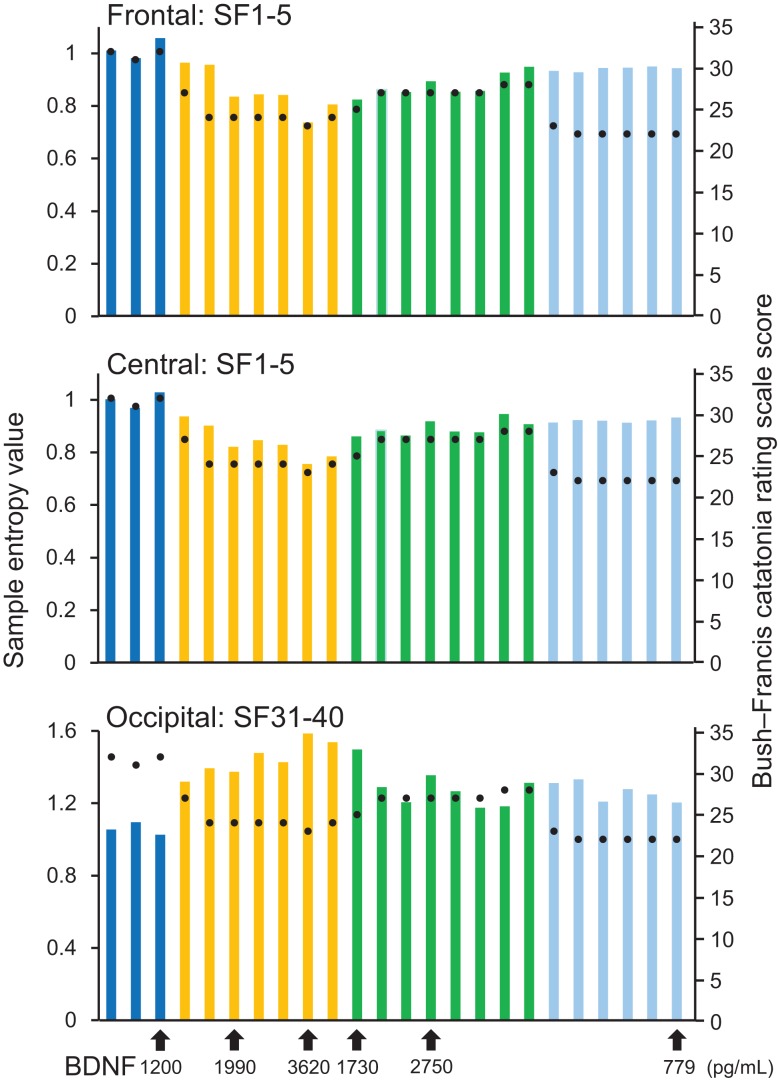
Figure 2.
Results from sample entropy (SampEn) values. In the upper and middle panels, each bar shows averaged SampEn values of SF 1–5 (i.e., light pink shaded area in Figure 1) and for the frontal and central regions (F3, F4, C3, and C4). Each bar in the lower panel shows averaged SampEn values of SF 31–40 (i.e., light blue shaded area in Figure 1) for the occipital region (O1 and O2). Each condition was identified by color: before-ECT as the blue bar, during-ECT as the yellow bar, after-ECT as the green bar, and during treatment with lorazepam as the light blue bar. Regarding the clinical course, the black circle shows the Bush–Francis Catatonia Rating Scale (BFCRF). The vertical axis on the right shows the scale of the BFCRS score. The black arrow below the horizontal axis shows the serum concentration of BDNF.

