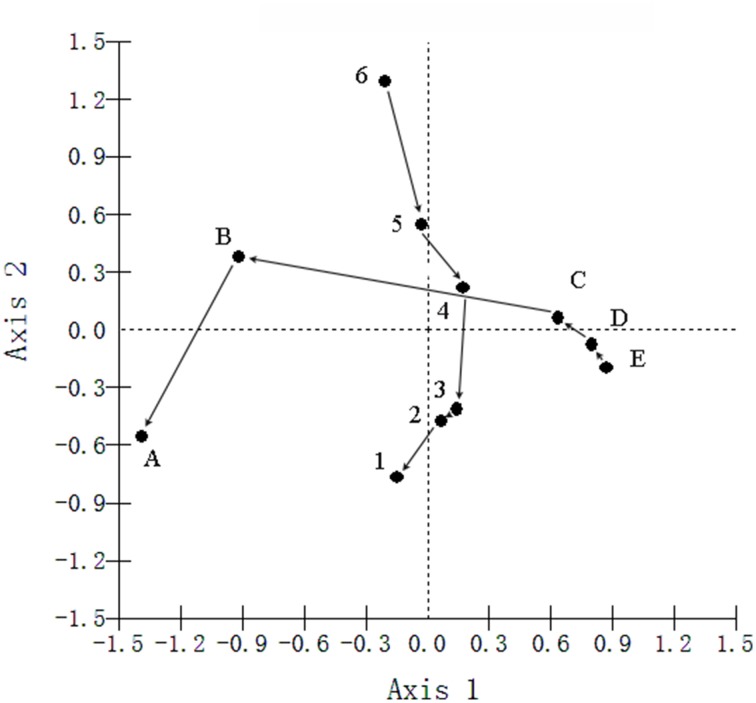
Figure 5.
Principal Component Analyses (PCA) of the bacterial communities, with symbols coded by depths or sites. A, B, C, D, and E were the five sediment locations, which were 0, 125, 250, 375, and 500 m from the water-land junction, respectively. At each location, there were six depth strata sampled per transect: 0–5, 5–10, 10–20, 20–30, 30–60, and 60–100 cm, which were indicated by numbers 1, 2, 3, 4, 5, and 6, respectively.

