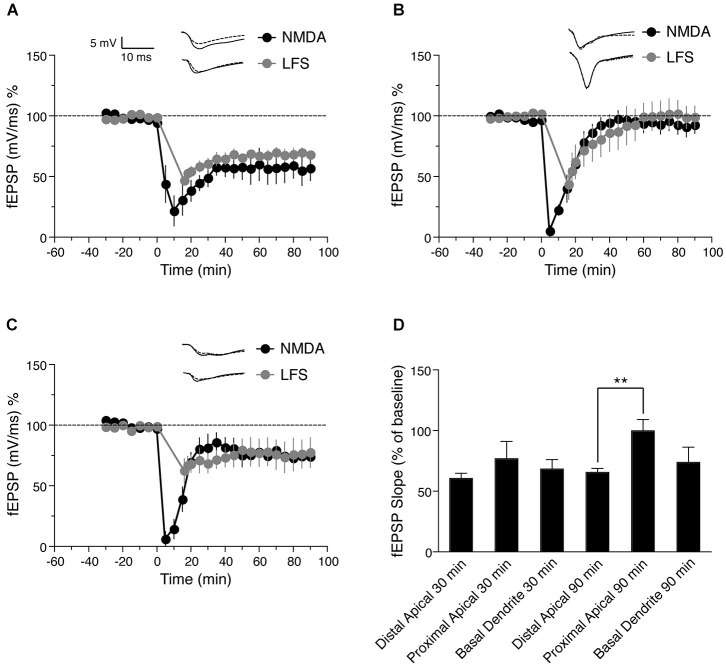
Figure 2.
Comparison of NMDA and low frequency stimulation (LFS)—induced LTD in distinct dendritic sub-regions of hippocampal CA1 neurons. (A) Time course of the change in the slope of the fEPSP recorded from distal apical dendrites after induction of LTD by application of 30 μM NMDA for 5 min (black circles, n = 6) or after induction of LTD by LFS (gray circles, n = 5). (B) Time course of the change in slope of the fEPSP recorded from proximal apical dendrites after NMDA-induced LTD (black circles, n = 6) or LFS-induced LTD (gray circles, n = 6). (C) Time course of the change in fEPSP slope recorded from basal dendrites after NMDA-induced LTD (black circles, n = 7) or LFS-induced LTD (gray circles, n = 4). (D) Comparison of LFS-induced LTD in distal, proximal and basal dendrites. The change in fEPSP is expressed as the percentage change from baseline. Analog traces represent typical fEPSPs from 30 min before (solid line) and 90 min after (dashed line) NMDA application or and LFS. Scale bar for all analog traces is 5 mV/10 ms as shown in panel (A).

