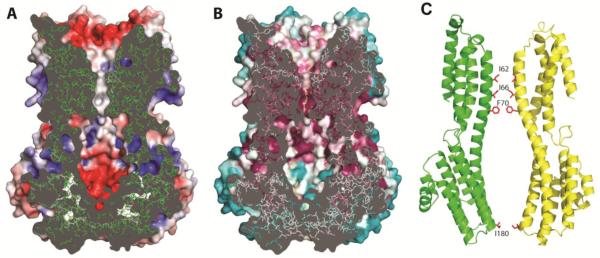
Fig. 2. Structure of the ion conducting pathway through KpBest.
(A) Cross-section through the pore center. The model is viewed as in 1D, with the electrostatic potential shown on exposed surfaces of the molecular envelope. (B) Cross-section as in A, but colored by Consurf sequence conservation. The calculation used 150 prokaryotic homologs with 95% maximal and 35% minimal sequence identities compared to KpBest. . (C) Ribbon diagram of two oppositely facing (144°) protomers of a KpBest pentamer are shown with the extracellular side on the top. The side chains of critical residues are red.

