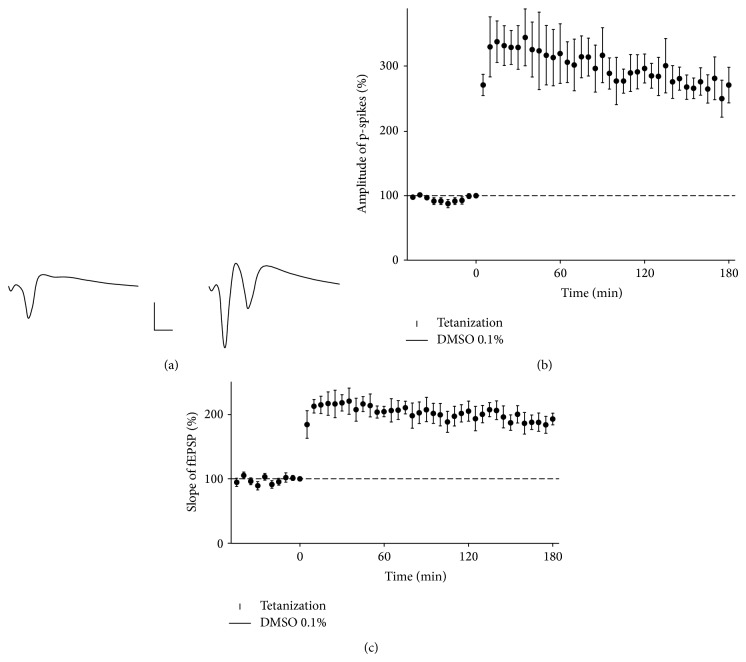
Figure 1.
Long-term potentiation in the rat hippocampal CA1 area. (a) Representative responses to test stimuli before tetanization (left) and 30 min after tetanization (right). Calibration bars: 3 ms, 1 mV. (b, c) Abscissa, the time from the onset of tetanization. Ordinate, the amplitude of p-spikes (b) or the slope of field excitatory postsynaptic potentials (c), which is normalized to the amplitude of the response to the stimulus that immediately preceded tetanization. The data are the mean ± S.E.M. (n = 4).

