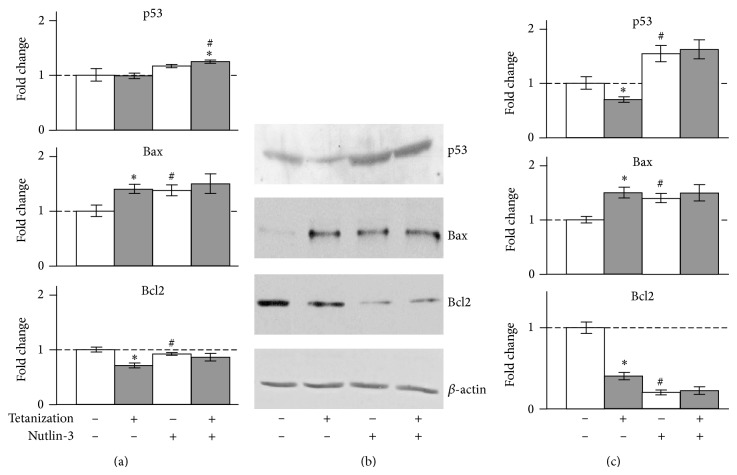
Figure 2.
Effect of tetanization on p53, Bax, and Bcl2 in the rat hippocampal CA1 area. (a) Total RNAs were prepared and subjected to real-time PCR for the measurement of mRNAs. The mean of Ct values of five housekeeping genes was used as internal control for normalization as described in Section 2. (b) Representative Western blots. Whole-cell extracts were prepared from the rat hippocampal CA1 area and subjected to Western blot analysis as described in Section 2. (c) Relative intensity. The protein bands were analyzed by the computerized densitometric program “Total Lab.” The intensities of the signals were determined from the areas under the curves for each peak and data were graphed. β-actin was used as internal control for normalization. The fold changes were expressed by taking the average value of the group tetanization(−)/nutlin-3(−) as one. * P < 0.05 against corresponding tetanization(−) samples (paired t-test), # P < 0.05 against the group tetanization(−)/nutlin-3(−) (t-test), n = 4.

