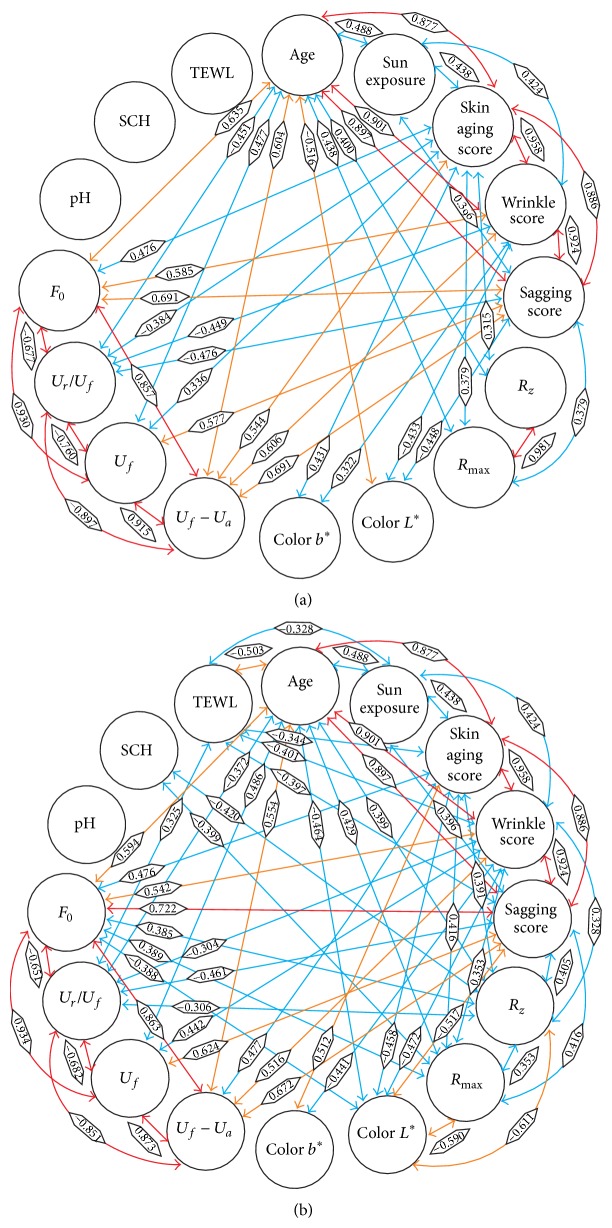
Figure 1.
Bivariate correlations between parameters on the right (a) and left (b) cheeks. Associated parameters are connected by an arrow. Pearson's correlation coefficients are presented on the arrows. The colour of the arrow indicates the strength of association between the parameters (0.3 < r ≤ 0.5, blue; 0.5 < r ≤ 0.7, orange; r > 0.7, red).

