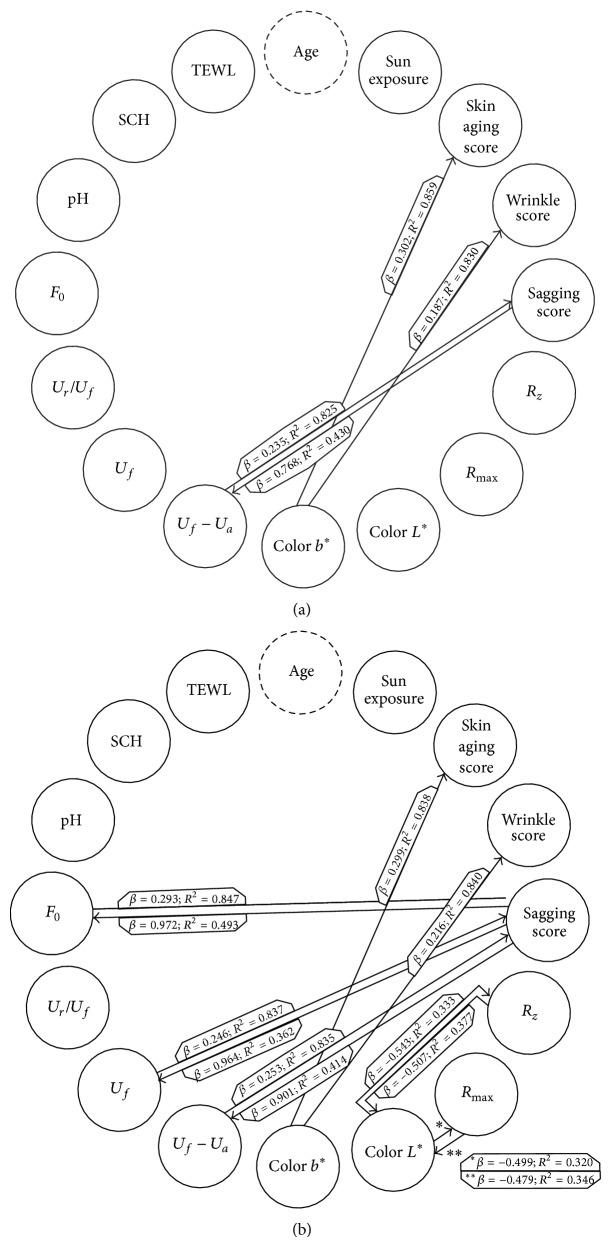
Figure 2.
Multivariate regression models adjusted for age for the right (a) and left (b) cheeks. Statistically significant associations are presented by an arrow. Each arrow points to the dependent variable of the given model. Beta coefficients of the independent variables and the adjusted model fits (R²) are indicated on the arrows.

