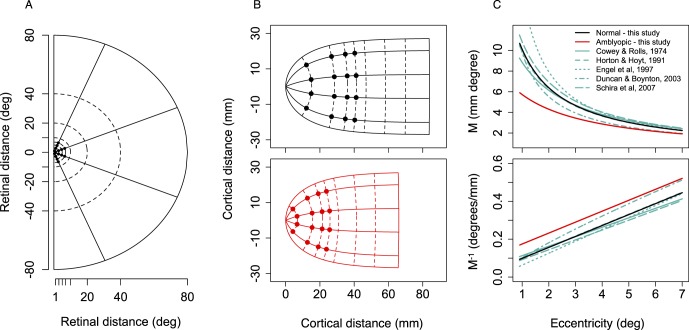
Figure 4.
Effect of changes in a on the retinotopic map. (A) Retinal map of right visual field extending to 80° of visual angle. Positions probed in task are shown as small black dots within 10° eccentricity. (B) Log-conformal cortical representation of the right visual field in the left hemisphere, given by imaginary versus real part of the complex logarithm of retinal polar coordinates (Equation 5), scaled by k = 17.3 mm (Horton & Hoyt, 1991), and centered on the fovea, that is, k ∗ log(z + a) − k ∗ log(a). Top: Normally sighted group (a = 0.71); positions probed in task shown as black symbols. Bottom: Amblyopic group (a = 2.02); positions probed in task shown as red symbols. Larger values of a shrink the retinotopic map, particularly at the inner eccentricities. (C) Top: Magnification factor, M, given by Equation 7 (M = k/E + a), plotted against eccentricity for the two groups alongside M reported in five other studies. Cowey and Rolls (1974): M = 0.063 + 0.05E; Horton and Hoyt (1991): M = 17.3/(E + 0.75); Engel et al. (1997): M = 1/(E + 0.063); Duncan and Boynton (2003): M = 9.81*E–0.83; Schira et al. (2007): M = 19.2/(E + 0.77). Bottom: M−1 for groups in the present study and the five studies shown in top panel.

