
Figure 3.
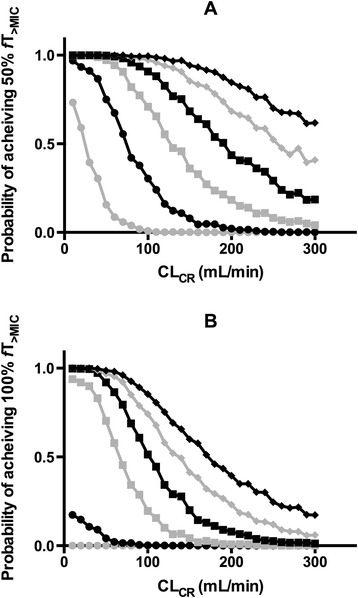
Probability of target attainment with varying creatinine clearance. Graphs depict the probability (%) of attaining 50% (A) and 100% (B) time above the minimum inhibitory concentration (fT>MIC) following a 4.5 g piperacillin-tazobactam dose administered every 6 hours as an intermittent 20-minute infusion, and CLCR values. Varying minimum inhibitory concentrations (MIC) are displayed: 2 mg/L (black diamonds), 4 mg/L (grey diamonds), 8 mg/L (black squares), 16 mg/L (grey squares), 32 mg/L (black circles), and 64 mg/L (grey circles).