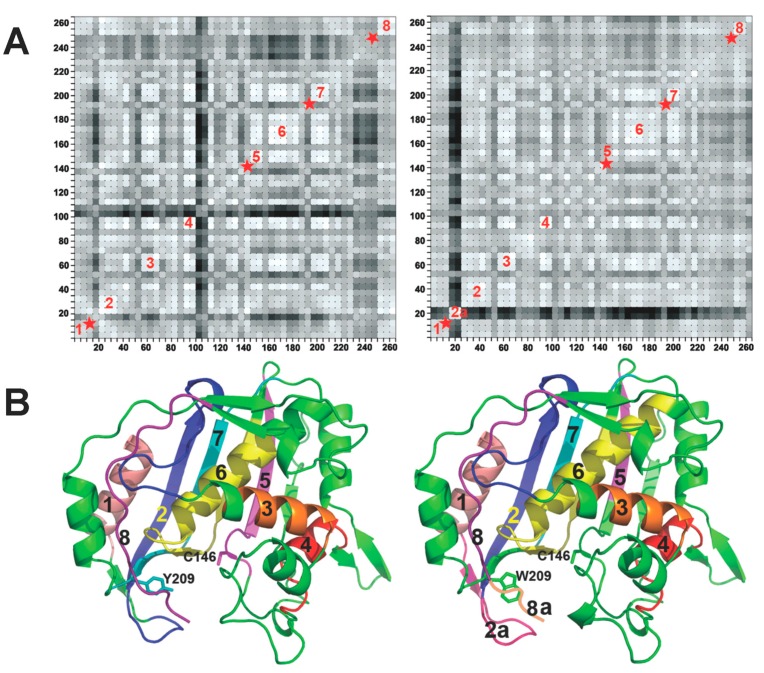
Figure 4.
(A) The residue-based matrix plots showing correlations of anisotropic B-factor displacements for TSase. The left plot is for WT TSase and the right plot is for Y209W TSase. Segment 2a in the right plot is the phosphate-binding loop with relatively higher B factors. (B) Ribbon diagrams of WT (left) and Y209W (right). The mutated residue, dUMP, catalytic cysteine and cofactor analog (CB3717) are shown as sticks. Reproduced from ref [11] with permission from the American Chemical Society.

