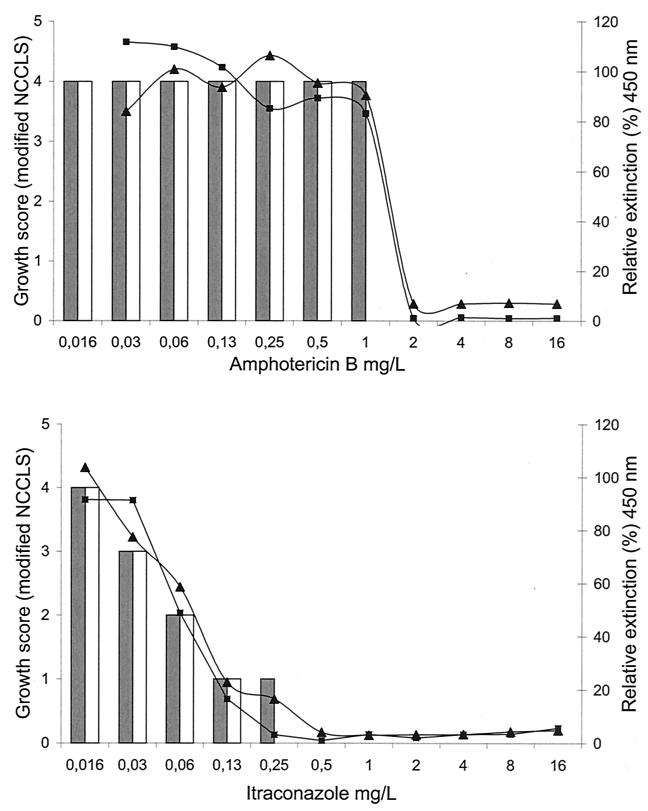
FIG. 2.
Antifungal susceptibility testing of M. mycetomatis strain mm-55 against AMB and ITC in duplicate. Curves represent the relative extinction at 450 nm for each drug concentration compared to the growth control (100%) obtained by the XTT assay. Bars represent the growth levels obtained by the modified NCCLS method as determined in a separate experiment.

