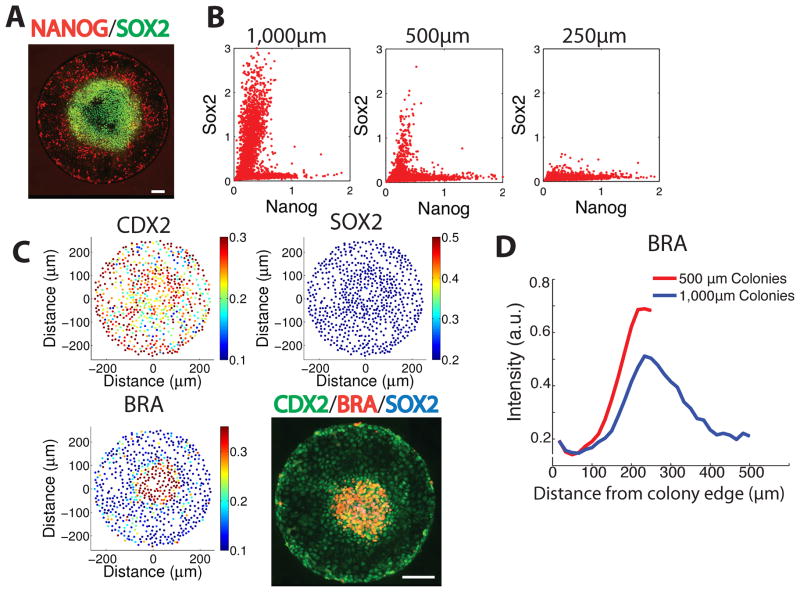
Figure 4. Control of cell fate extends from the edge of the colony.
(A) Immunofluorescence for SOX2 and NANOG in a 1000μm colony following 42h BMP4 treatment. (B) Quantification of single cell expression of SOX2 and NANOG from immunofluorescence data showing a shift from the SOX2+ ectodermal population towards the NANOG+ mesendodermal population as the colony size is reduced. (C) Immunfluorescence in a 500 μm colony shows BRACHYURY expression at the center rather than in an annulus at fixed radius and the absence of staining for SOX2. Quantification of markers with single-cell resolution in a 500μm colony shows an absence of SOX2 and the expression of BRA in the colony center. (D) Comparison of BRACHYURY expression between 500μm and 1000μm colonies shows the spatial scale of expression is the same in the two sizes. Note the distance scale is inverted relative to previous panels to emphasize control from the boundary. All scale bars are 100μm.

