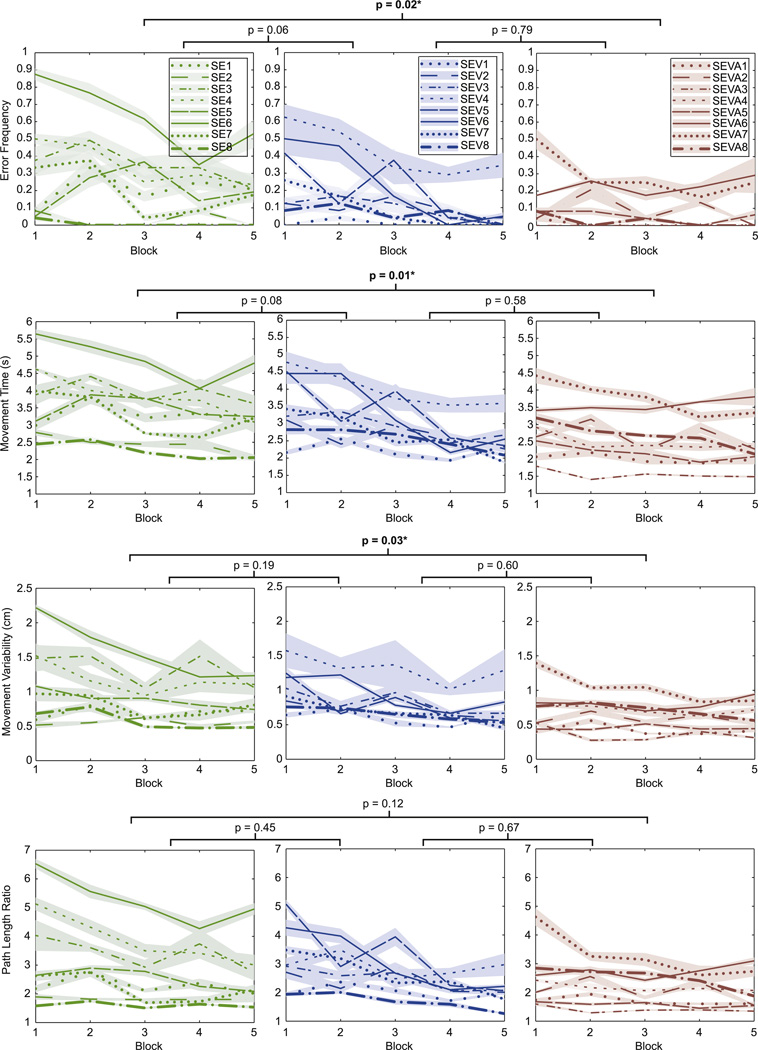
Figure 3.
Subject performance for five blocks. Each subject’s mean performance (dark line) and standard error (shaded area) is shown for each of the five reaching blocks. A different line type representing each subject and each group is shown in a different coluor. The results for the ANOVA are shown by the p-value on top of the line connecting two plots.

