Fig. 1.

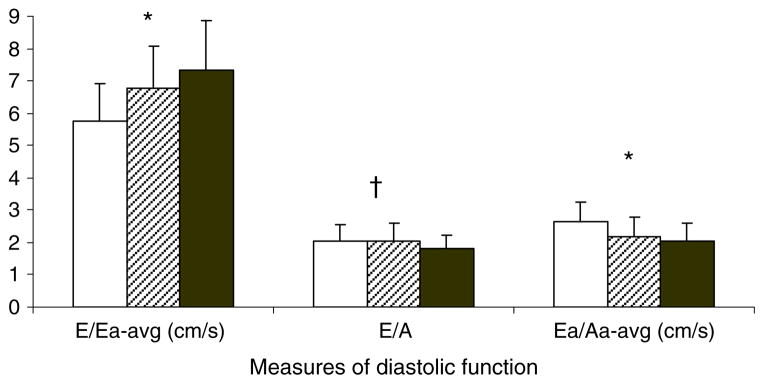
Diastolic function by group (mean and SD). White bars, lean; cross-hatched bars, obese; black bars, type 2 diabetes. Lean < obese < obese type 2 diabetes, *p<0.05. Lean and obese < obese type 2 diabetes, †p<0.05. avg, average

Diastolic function by group (mean and SD). White bars, lean; cross-hatched bars, obese; black bars, type 2 diabetes. Lean < obese < obese type 2 diabetes, *p<0.05. Lean and obese < obese type 2 diabetes, †p<0.05. avg, average