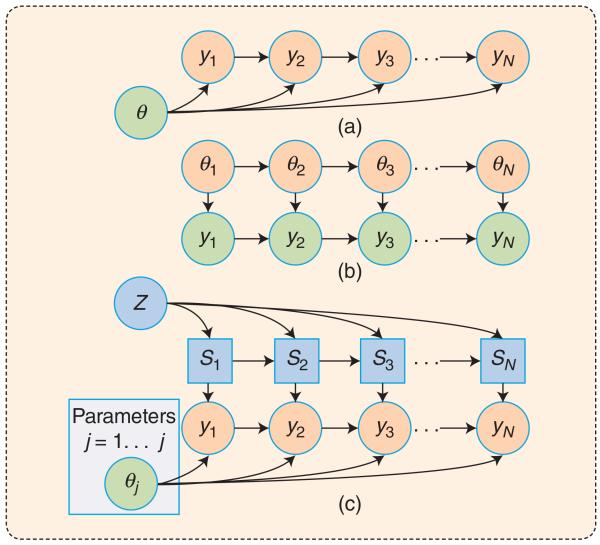
FIGURE 2.
A graphical model representation of the time-series models: (a) a first-order VAR model with static parameters θ, (b) a TVAR with dynamic patameters θ1…θN, and (c) an SVAR model, which includes a collection of J VAR models, with the Markov transition matrix Z. Each node represents a random variable, and the lack of an edge represents the conditional independence relationship among the variables. The time-series samples y1,…, yN are observed, and the remaining variables are latent.

