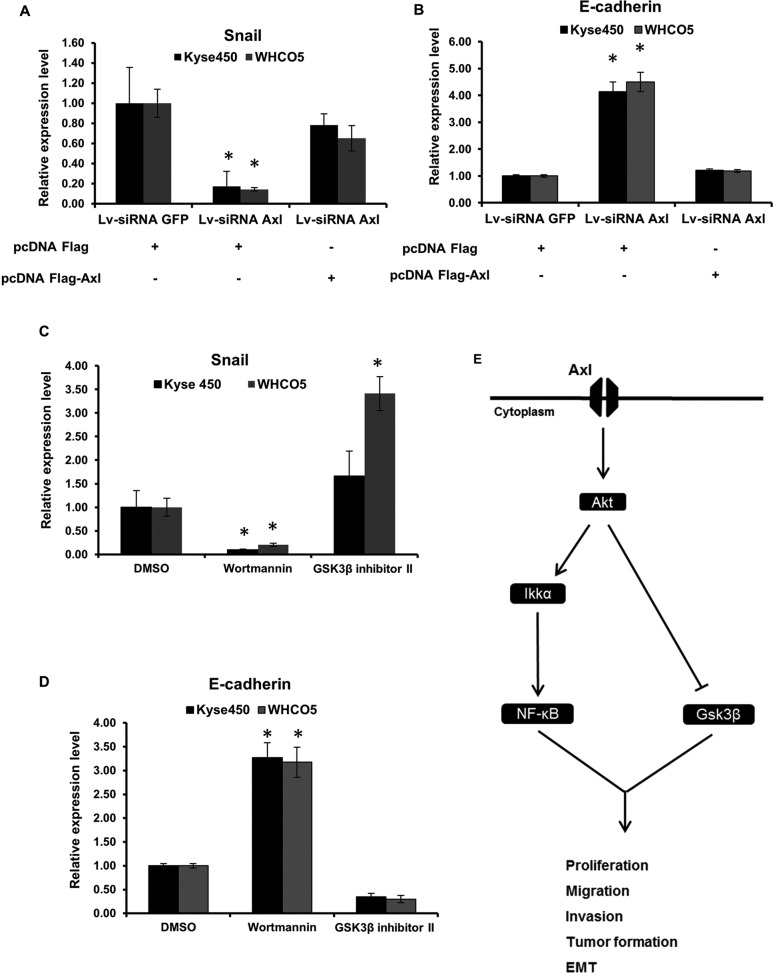
FIGURE 6:
Analysis of EMT markers regulated by Axl in OSCC. RT-PCR analysis of Snail (A) and E-cadherin (B) in OSCC. Analysis was performed in Kyse450 and WHCO5 cells and their knockdown pairs (Kyse450 siRNA Axl and WHCO5 siRNA Axl) transfected with pcDNA Flag-Axl or pcDNA plasmids as control. (C and D) Analysis of EMT markers regulated by Axl in OSCC treated with wortmannin and GSK3β inhibitor II. Kyse450 and WHCO5 cells were treated with GSK3β inhibitor II (200 nM) for 2 h or with wortmannin (1 mM) for 30 min. RT-PCR analysis of E-cadherin (C) and Snail (D) in Kyse450, Kyse450 siRNA Axl, and Kyse450 siRNA Axl transfected with pcDNA Flag-Axl. Total RNA was collected from cells, and normalization of each sample was carried out by measuring the amount of human GAPDH cDNA. Data shown are mean ± SD of triplicate independent experiments for each condition; *, p < 0.01. (E) Schematic representation of Axl pathway in OSCC.

