FIGURE 1:
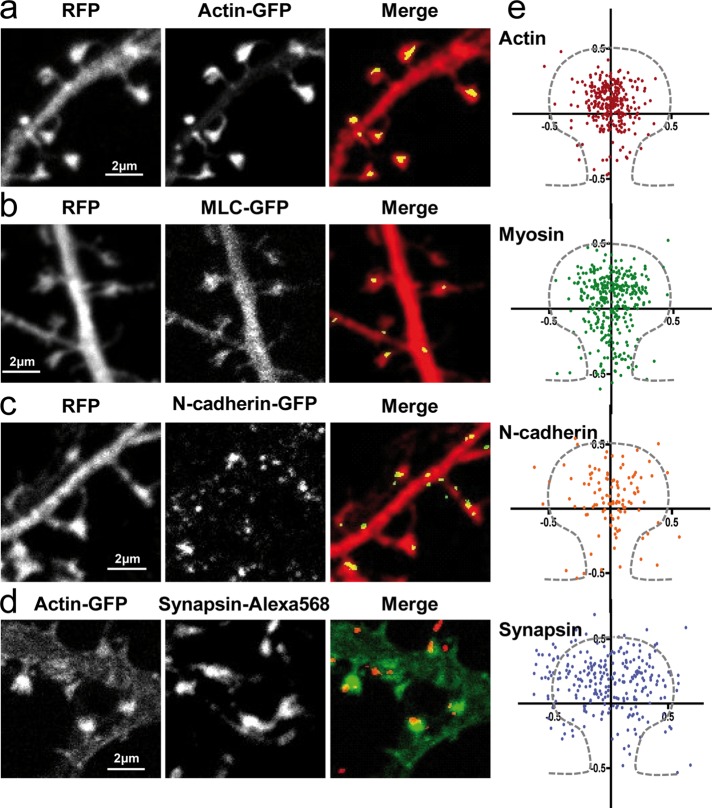
Localization of N-cadherin, actin, and myosin expressed in dendritic spines. (a–c) Neurons cotransfected with RFP and actin-GFP, MLC-GFP, or N-cadherin-GFP were fixed at DIV 18–21, dual-immunolabeled for GFP and RFP, and examined by confocal microscopy. Primary anti-DsRed and Alexa 568–conjugated secondary antibodies were used to enhance the RFP signal, whereas primary anti-GFP and ATTO-647–conjugated secondary antibodies were used to enhance the GFP signal. (d) Neurons transfected with actin-GFP were labeled for the presynaptic marker synapsin. (e) As shown in the merge panels, GFP images were segmented to yield the coordinates of actin, MLC, N-cadherin, and synapsin puncta relative to the centroid of the spine obtained from the RFP image. Those data were normalized by the width and length of the spine, providing a plot of the relative distributions of each protein. An average spine profile is indicated by dashes. Some of the synapsin staining that seems to appear within the spine is likely due to the three-dimensional architecture not resolved in these two-dimensional images and the diffraction limits of conventional microscopy. Nonetheless, the distribution of points for synapsin was significantly different from that of the three other proteins (data analyzed by Mann–Whitney test, ***p < 0.005).

