FIGURE 2:
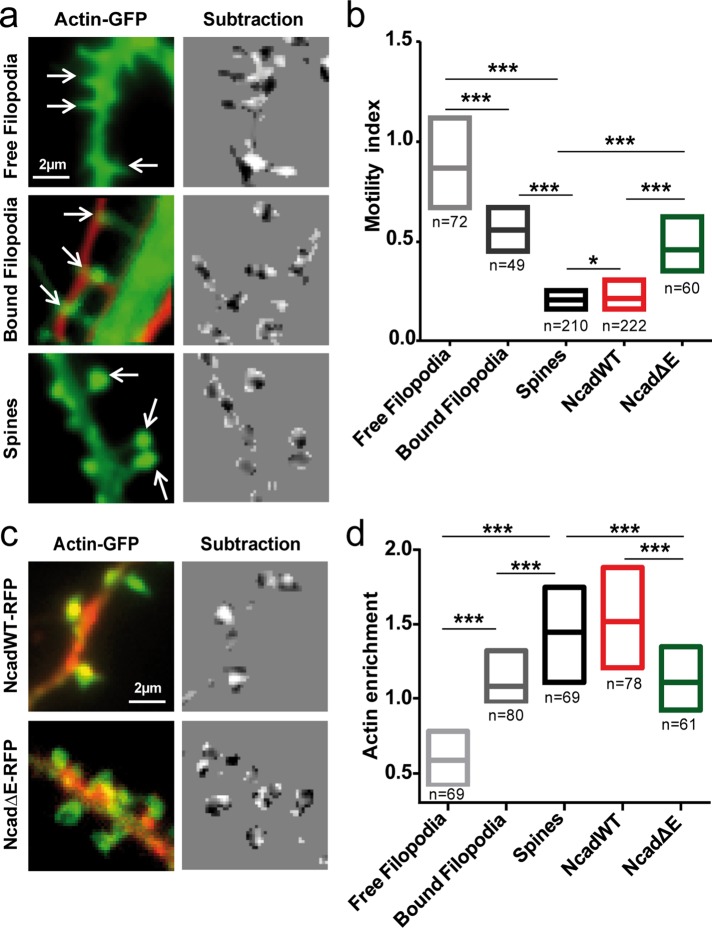
Actin-driven motility of dendritic filopodia and spines. (a) Two neuronal populations were electroporated with actin-GFP or RFP and imaged at DIV 8–10 for observation of free dendritic filopodia (top) and bound dendritic filopodia and axons (middle). Independently, neurons were transfected with actin-GFP and imaged at DIV 17–21 for observation of dendritic spines (bottom). Images of actin-GFP (left) were taken every 5 s for 5 min. Consecutive images were segmented and subtracted (right), making protrusions appear white and retractions appear dark. The normalized intensity variance of these images was calculated for each spine or filopodium and defined as the instantaneous motility index. (b) The individual motility index integrated over time is presented as interquartile distributions for filopodia and spines in all conditions. (c) Neurons were cotransfected with actin-GFP and either NcadWT-RFP or NcadΔE-RFP and observed at DIV 17-21. Left, the actin-GFP images (green) were merged to the RFP images (red) to show the distribution of the N-cadherin constructs. Right, corresponding subtracted images of actin-GFP. (d) Interquartile distributions of the motility index for the Ncad constructs. The number of filopodia or spines examined is given under each bar. Data were analyzed by one-way analysis of variance (ANOVA) and compared two by two using Dunnett's posttest. *0.01 < p < 0.05; ***p < 0.001.

