FIGURE 3:
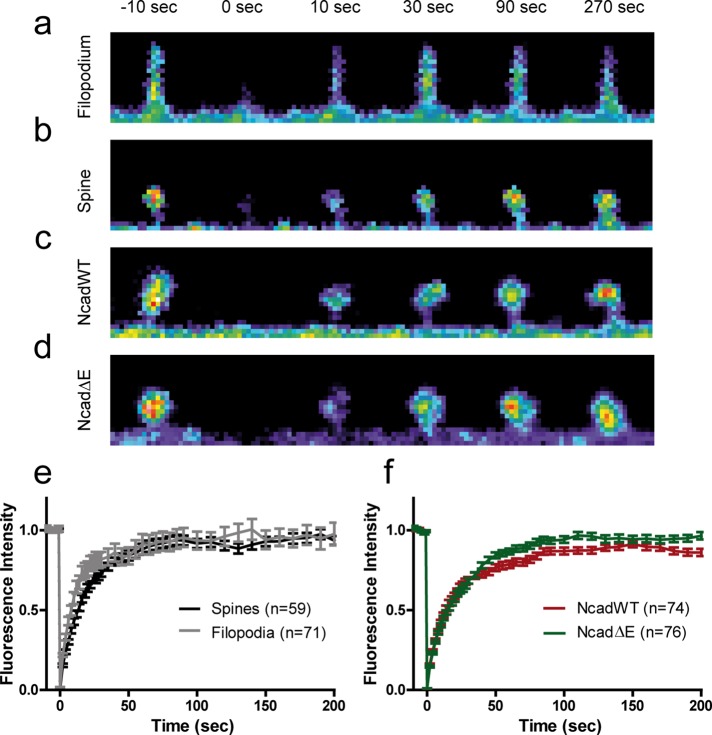
FRAP experiments on actin-GFP in dendritic filopodia and spines. (a, b) Images of a dendritic filopodium and spine, respectively, in which actin-GFP was photobleached at time 0 and allowed to recover for 300 s. (c, d) Images of dendritic spines coexpressing NcadWT-RFP or NcadΔE-RFP, respectively, in which actin-GFP was photobleached at time 0 and allowed to recover for 200 s. (e) Recovery of actin-GFP fluorescence in dendritic filopodia and spines. The average curves were fitted by a single-exponential function, m[1 − exp(−κt)], where m is the mobile fraction and κ a characteristic rate constant, yielding the values m = 0.92 ± 0.01 and 0.90 ± 0.01 (not significantly different) and κ = 5.5 ± 0.4 and 3.2 ± 0.2 min−1 (p < 0.001, by extra sum of squares F test) for filopodia and spines, respectively. (f) Recovery of actin-GFP fluorescence in dendritic spines from neurons coexpressing NcadWT-RFP or NcadΔE-RFP. Parameters from exponential fits were m = 0.83 ± 0.01 and 0.94 ± 0.01 (p < 0.001), and κ = 3.5 ± 0.1 and 2.5 ± 0.1 min−1 (p < 0.001 by extra sum of squares F test) for NcadWT and NcadΔE, respectively. The number of filopodia/spines examined in each condition is given in the keys.

