FIGURE 5:
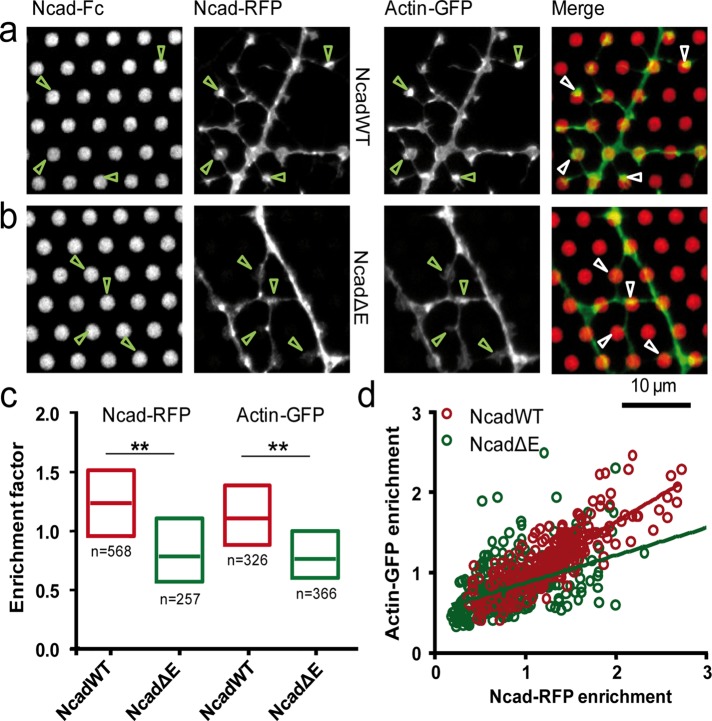
Formation of actin-rich dendritic filopodia on N-cadherin coated micropatterns. (a, b) Neurons coexpressing actin-GFP and either NcadWT-RFP or NcadΔE-RFP, respectively, were cultured on micropatterned substrates coated with Ncad-Fc and immobilized through Cy5-conjugated anti-Fc antibodies. Images show (from left to right) the Cy5, RFP, GFP, and merge between actin-GFP (green) and micropatterns (red). (c) Enrichment levels of Ncad-RFP and actin-GFP at Ncad-Fc micropatterns in NcadWT-RFP and NcadΔE-RFP conditions. The two conditions were compared by a Mann–Whitney test separately for each staining (actin-GFP or Ncad-RFP). **0.001 < p < 0.01. The number of micropatterns analyzed was 257 for NcadWT-RFP and 291 for NcadΔE-RFP (four cells in each condition). (d) Plot of actin-GFP vs. Ncad-RFP signals for the NcadWT and NcadΔE conditions, respectively. The correlation coefficient was r = 0.83 for NcadWT (p < 0.0001, n = 257 dots) and 0.45 for NcadΔE (p < 0.0001, n = 291 dots).

