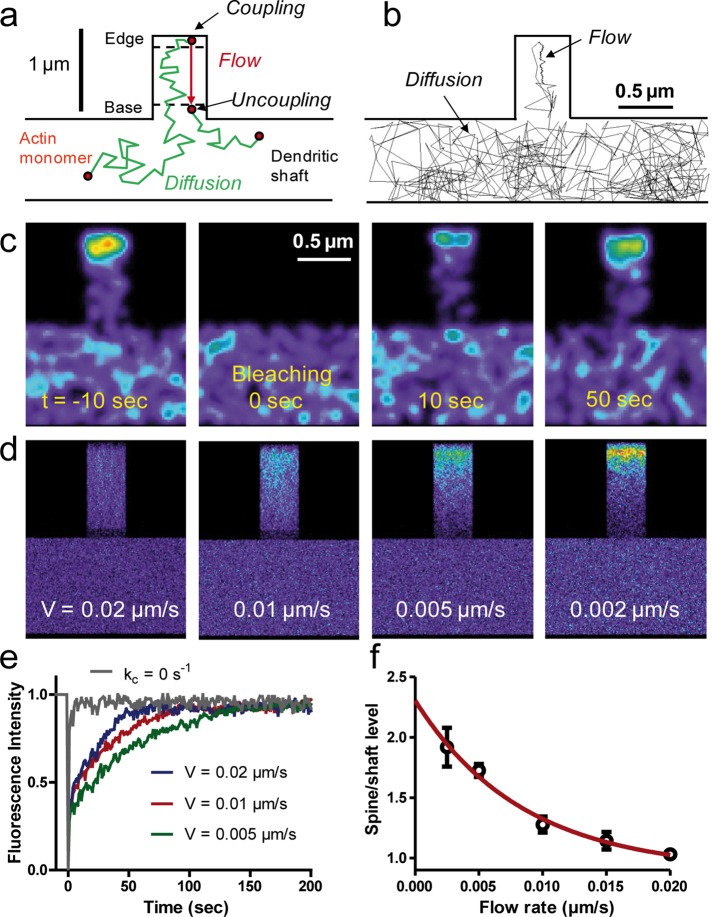
FIGURE 7:
Computer simulations of actin dynamics in model dendritic structures. (a) Model description. Actin monomers transit between fast random diffusion in the shaft and filopodium and slow directional flow originating from the filopodium tip. (b) Example of a 450-s trajectory for a single actin monomer with time step 50 ms. Arrows indicate diffusion and trapping in the F-actin flow. (c) Simulated FRAP experiment for a flow velocity of 0.01 μm/s. Each actin molecule is represented by a Gaussian distribution of fluorescence coded in false colors. (d) Images of actin distribution obtained from integrating 1000 computer simulations of actin dynamics. Examples with different flow velocities. (e) FRAP curves for different flow velocities, each curve being an average of four independent sets of 1000 simulations. Note that increasing V accelerates recovery. The gray curve corresponds to actin monomer diffusion only (kc = 0, no trapping). (f) Relationship between actin enrichment and actin flow rate. Each point represents an average ± SD of eight spines from four independent sets of simulations. The red line is a fit with an exponentially decreasing function.

