FIGURE 8:
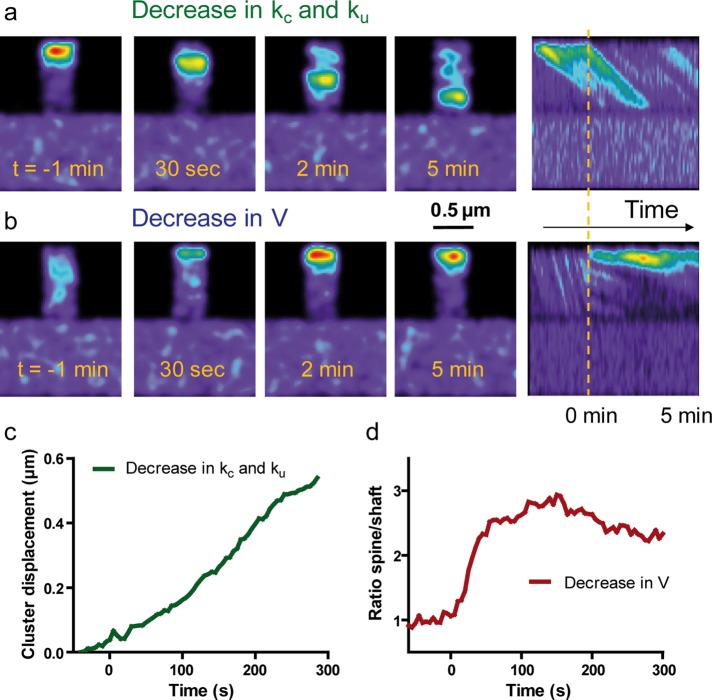
Predictions of experiments by changing parameters controlling actin dynamics. Different parameters in the simulations were changed after initial equilibrium is reached (150 s set as time 0), and then actin redistribution was monitored using the Gaussian representation. (a) The polymerization rate kc was decreased from 0.5 to 0.05 s−1, and the dissociation rate ku was decreased from 0.05 to 0.002 s−1. Note the gradual retraction of the actin cluster from the tip to the base of the filopodium, as observed in calyculin A experiments. (b) The actin flow rate was changed from V = 0.02 to 0.002 μm/s to mimic clutch engagement between N-cadherin adhesions and the actin/myosin network. Note a gradual accumulation of actin at the tip of the spines up to steady state. Right, kymographs represent actin intensity across the shaft and spine over time. Note changes in intensity and the diagonal slopes, reflecting actin flow rates. The dashed line indicates time 0. (c) Displacement of the actin cluster over time in response to a change in both kc and ku. (d) Actin enrichment vs. time in response to a change in V.

