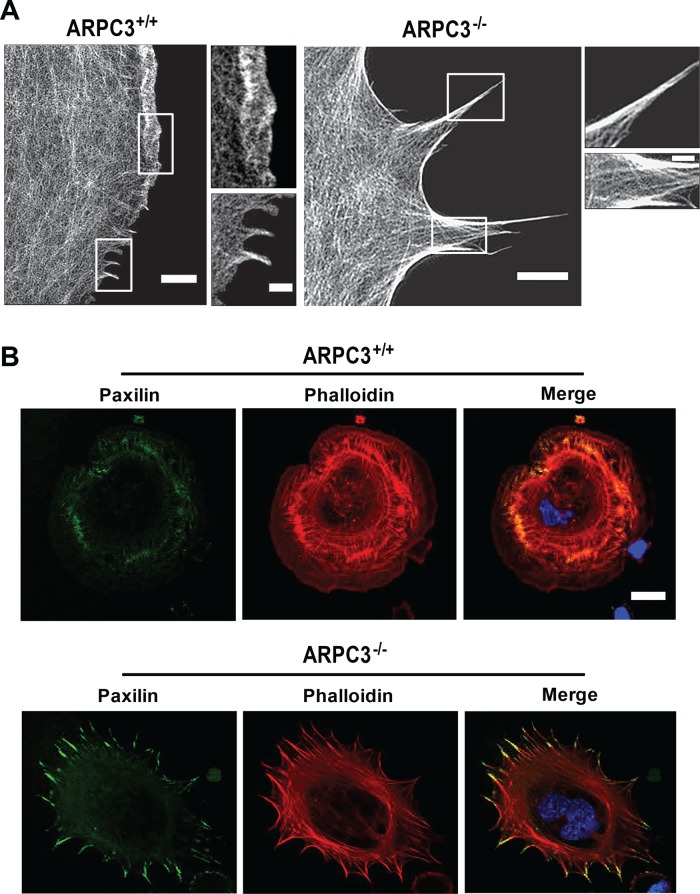
FIGURE 1:
Actin organization at the leading edge and paxilin localization in wt and ARPC3−/− fibroblasts. (A) Spreading wt and ARPC3−/− cells were stained with fluorescent phalloidin and imaged by SIM. The white boxes represent the zoomed regions in the corresponding images. (B) Spreading ARPC3+/+ (top panels) and ARPC3−/− cells (bottom panels) were stained with antibodies against paxilin (green), Alexa Fluor 546 phalloidin for F-actin (red) and DAPI to visualize the nucleus (blue). Representative images are shown. Scale bars: (A) wt 2 μm, 1.5 μm (zoom) and ARPC3−/− 2.5 μm, 1.5 μm (zoom); (B) 20 μm.

