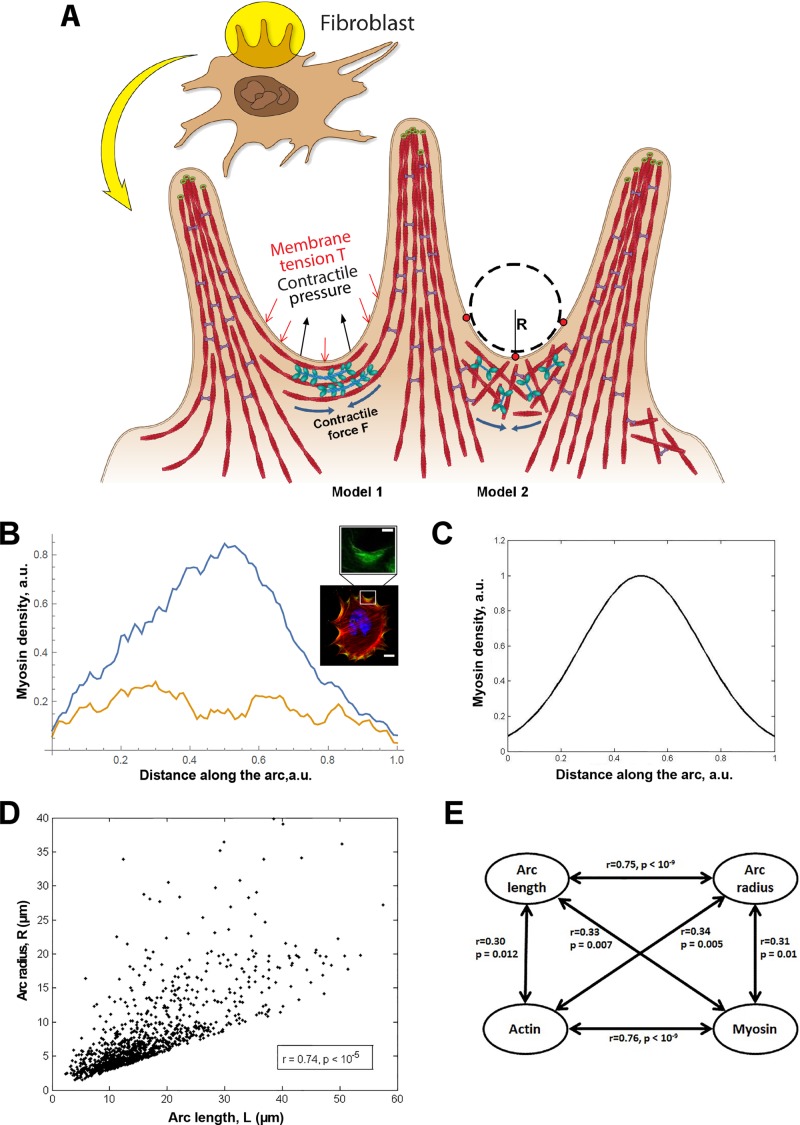
FIGURE 5:
Force-balance model of leading-edge protrusion based on coordinated action of formin and myosin II. (A) Simple cartoon diagram depicting the key elements of the leading edge formed in the absence of the Arp2/3 complex. Small green circles: formin at actin barbed ends; red filaments: actin filaments; blue lines with green ovals: myosin II. Parameters of the model, R, F, and T are shown in the diagram. L (not shown) is arc length between the two outside red dots at the base of adjacent filopodia. Models 1 and 2 vary in the organization of actin-myosin assemblies at the arc region. (B) Plots show average density distribution of active myosin (blue) and the SD of the density (orange) as a function of the spatial coordinate along the arcs. The measurements were performed on 11 arcs in three different cells. A representative ARPC3−/− mutant cell stained for active myosin II (anti-p-MYL9) and actin (fluorescent phalloidin) are shown in the side panels. The white box shows an example arc area in which phosphomyosin distribution was measured. The maximal density and the half-arc length were normalized to 1. (C) The distribution of active myosin density in the arc predicted from solving the force balance equation for the actomyosin flow and the diffusion-drift equation for the myosin density (see the text). We used nondimensional parameter values a = 5 and b = 1 for the plot. (D) Correlation of arc radius R with arc length L, from measurements made in a total of 12 spreading ARPC3−/− cells from six movie frames for each cell. (E) Correlations of the arcs' radii and lengths with actin and myosin densities at the arc centers. All pairs of these four variables correlate. The r and p values for each pair are shown. Scale bars: (B) 25 μm; 5 μm (zoom).

