FIGURE 6:
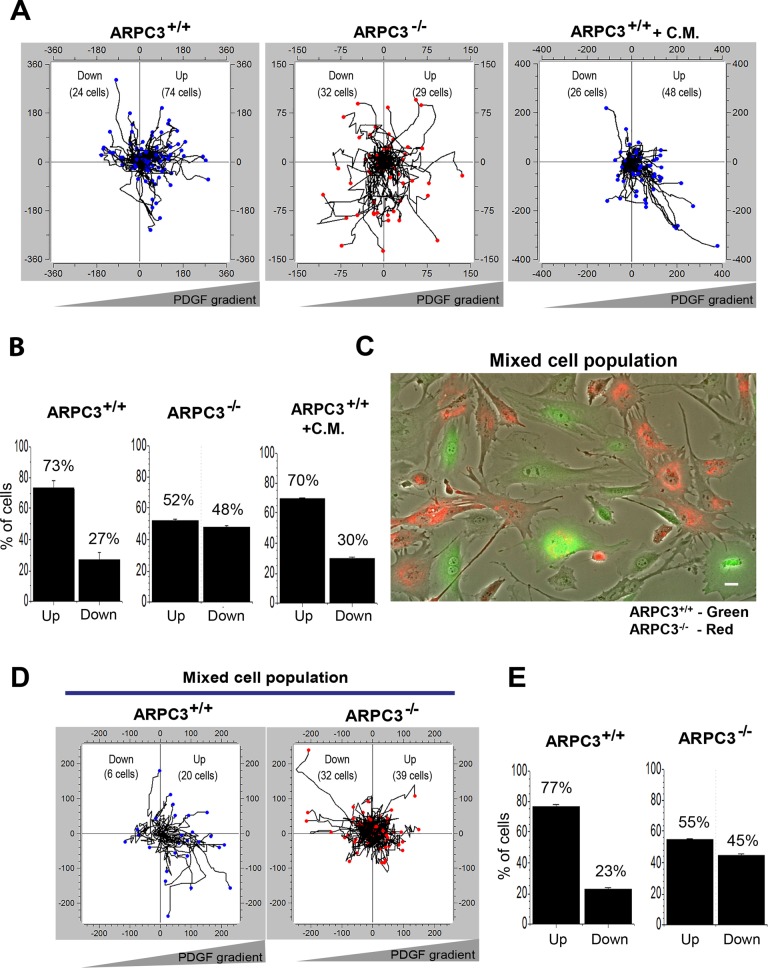
ARPC3−/− fibroblasts have a cell-autonomous defect in chemotaxis. (A) Plots show trajectories of individual ARPC3+/+ (left panel) or ARPC3−/− (middle panel) cells migrating in a PDGF gradient. Right panel shows ARPC3+/+ cells migrating in PDGF gradient in the presence of ARPC3−/− cell-conditioned media (C.M.). (B) Histograms of the percentage of cells migrating toward (up) or away (down) the PDGF gradient in the experiments in A. Shown are mean and SEM from three experiments. (C) The ARPC3+/+ and ARPC3−/− cells were labeled with green or red live-cell tracker dye separately and were then mixed and subjected to a chemotactic assay in the presence of a PDGF gradient (500 ng/ml at the source). Shown is a representative field of a mixed population of ARPC3+/+ (green) and ARPC3 −/− (red) cells in the chemotactic chamber. (D) Plots show trajectories of individual ARPC3+/+ and ARPC3−/− cells (in the mixed-cell population in which the wt to mutant cell ratio was ∼1:3) migrating in a PDGF gradient. (E) Histograms of the percentage of cells migrating toward (up) or away (down) the PDGF gradient. Shown are mean and SEM from three experiments.

